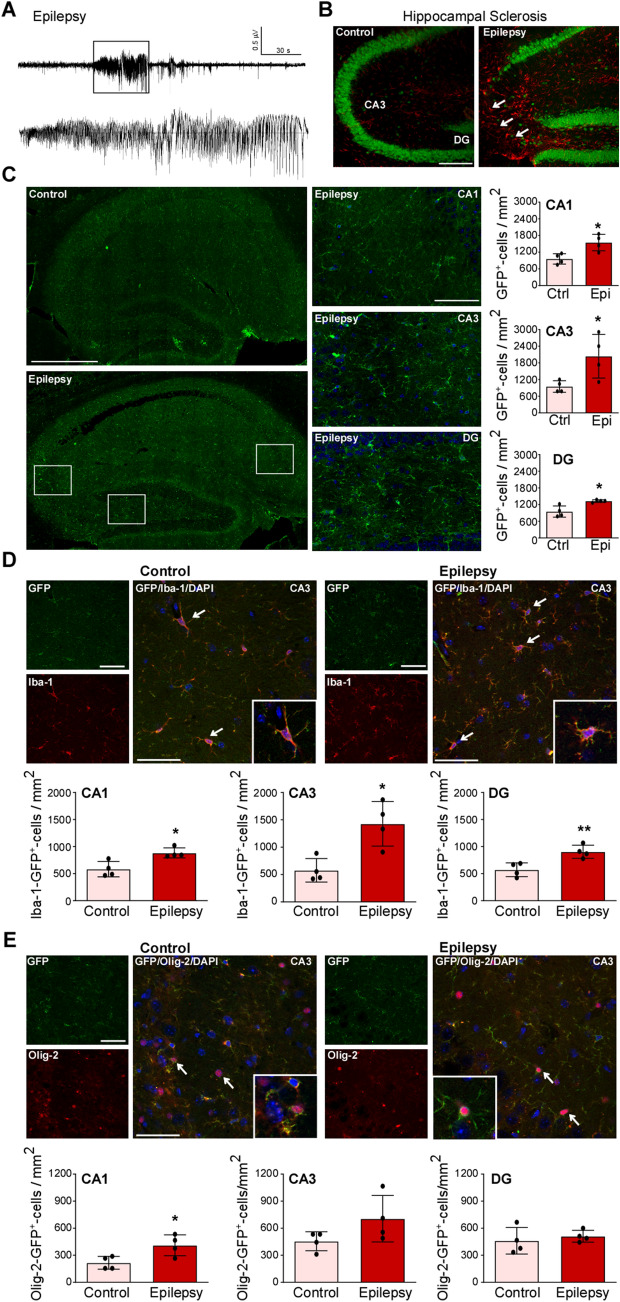
Fig. 5.
Increased P2X7-EGFP expression in the hippocampus during chronic epilepsy. A Representative EEG trace depicting high-frequency high-amplitude spiking during an epileptic seizure recorded from cortical electrodes in P2X7-EGFP mice at day 10 post-SE. B Representative photomicrographs (20 × magnification) showing reactive astrocytes (GFAP, red) and loss of NeuN-positive neurons (green) in the ipsilateral CA3 subfield in epileptic P2X7-EGFP mice 14 days post-SE [note decreased neuronal density in the ipsilateral CA3 subfield (arrows)]. C Left panels, representative tiled photomicrographs (40 ×) showing GFP-positive cells throughout the ipsilateral hippocampus in vehicle-injected controls and mice 14 days post-SE; right panels, higher magnification of each hippocampal subfield (CA1, CA3 and DG) from epileptic P2X7-EGFP mice and histograms showing more GFP-positive cells in each hippocampal subfield 14 days post-SE (CA1 Ctrl vs Epileptic, 959.3 ± 94.11 vs 1548 ± 148.2, P = 0.0153; CA3 Ctrl vs Epileptic, 950.0 ± 104.4 vs 2039.0 ± 392.1, P = 0.0364; DG Ctrl vs Epileptic, 950.0 ± 100.4 vs 1328.0 ± 22.91, P = 0.0105; n = 4 per group). Scale bars, 50 µm. D Representative images (40 × , CA3) and histograms showing more Iba-1-positive and GFP-positive cells in all three hippocampal subfields in epileptic P2X7-EGFP mice 14 days post-SE (CA1 Ctrl vs Epileptic, 583.3 ± 71.07 vs 883.3 ± 46.59, P = 0.0124; CA3 Ctrl vs Epileptic, 577.8 ± 107.7 vs 1428.0 ± 203.7, P = 0.0102; DG Ctrl vs Epileptic, 572.2 ± 63.75 vs 905.6 ± 60.43, P = 0.009; n = 4 per group). Scale bars, 50 µm. E Representative images (40 × , CA1) and histograms showing more Olig-2-positive and GFP-positive cells in the CA1 subfield in epileptic P2X7-EGFP mice 14 days post-SE (CA1 Ctrl vs Epileptic, 216.7 ± 35.57 vs 411.1 ± 57.74, P = 0.0285; n = 4 per group). No differences between groups were found in CA3 and DG (n = 4 per group). Scale bars, 50 µm. *P < 0.05, **P < 0.01, ***P < 0.001.

