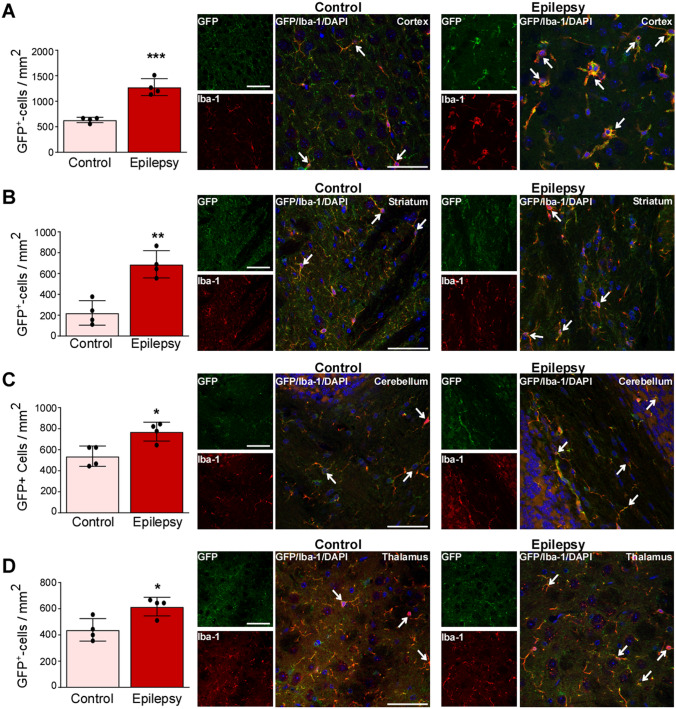
Fig. 6.
Increased microglial and oligodendrocyte expression of P2X7-EGFP during chronic epilepsy. A–D Histograms and representative images (40 ×) showing more GFP-positive cells in epileptic P2X7-EGFP mice, mainly localized to Iba-1-positive microglia and Olig-2-postitive oligodendrocytes in (A) cortex (Ctrl vs Epileptic, 633.3 ± 26.45 vs 1278.0 ± 82.40, P = 0.0003; n = 4 per group), (B) striatum (Ctrl vs Epileptic, 611.1 ± 29.40 vs 844.4 ± 32.71, P = 0.0018; n = 4 per group), (C) cerebellum (Ctrl vs Epileptic, 538.9 ± 48.33 vs 755.6 ± 58.79, P = 0.0349; n = 4 per group), and (D) thalamus (Ctrl vs Epileptic, 438.9 ± 42.91 vs 616.7 ± 35.57, P = 0.0189; n = 4 per group). Scale bars, 50 µm. *P < 0.05, **P < 0.01, ***P < 0.001.

