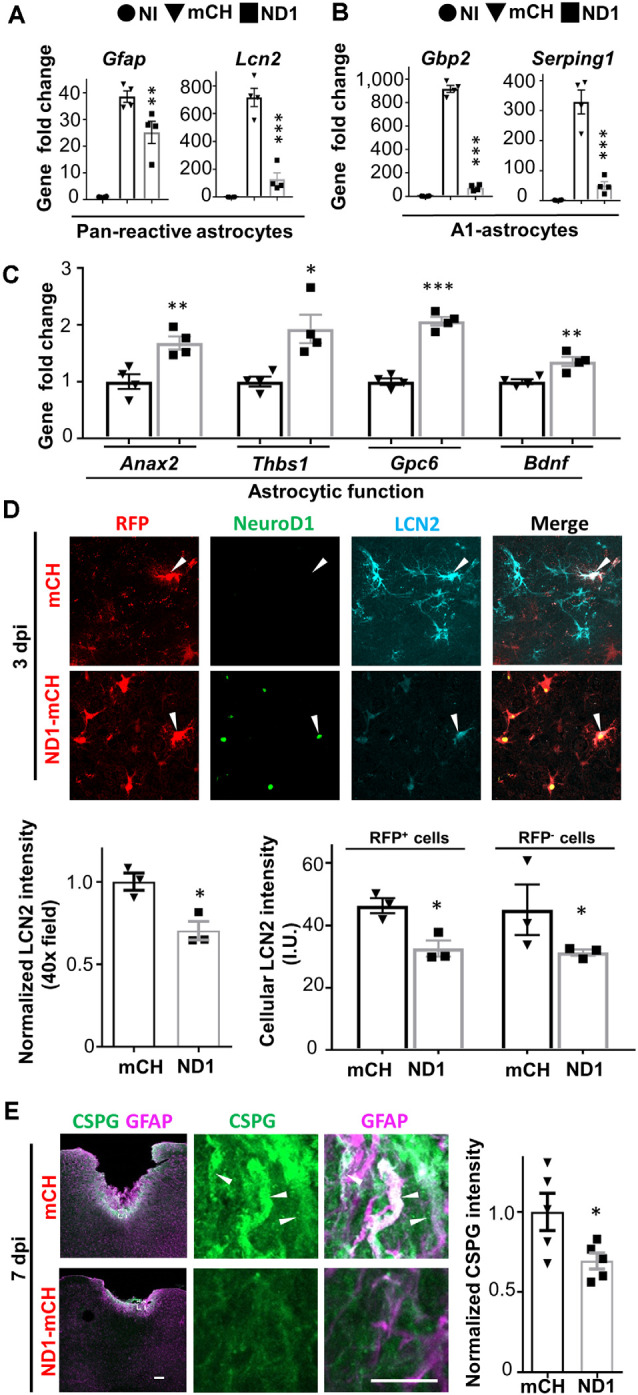
Figure 3.

NeuroD1 transformed A1-type reactive astrocytes at an early point. (A) Quantitative real-time PCR (qRT-PCR) analysis revealed a dramatic increase of reactive astrocytic genes Gfap and Lcn2 after stab injury, which was significantly attenuated in NeuroD1-infected areas. n = 4 mice. Each dot represents one animal. **P < 0.01, ***P < 0.001, one-way ANOVA followed with Sidak’s test. (B) A1 type astrocyte genes Gbp2 and Serping1 were upregulated several hundred folds in stab-injured cortices compared to non-injured cortices, but markedly reduced in NeuroD1-infected cortices. n = 4 mice. Each dot represents one animal. ***P < 0.001, one-way ANOVA followed with Sidak’s test. (C) More quantitative analyses with qRT-PCR revealed a significant upregulation of astrocytic functional genes in NeuroD1-infected cortices compared to the mCherry control group. n = 4 mice. Each dot represent one animal. *P < 0.05, **P < 0.01, ***P < 0.001, Student’s t-test. (D) Representative images showing that in control-AAV infected injury sites, neural injury marker lipocalin-2 (LCN2) was highly expressed (top row, arrowhead; 3 dpi). In contrast, the NeuroD1-infected area showed a much-reduced LCN2 signal (bottom row, arrowheads). Scale bar = 20 μm. Bar graphs: quantitative analyses revealed a reduced LCN2 expression in both NeuroD1-infected or non-infected cells compared to the control-AAV infected/non-infected cells. n = 3 mice. Each dot represents one animal. *P < 0.05, Student’s t-test. (E) Representative images showing the high expression level of chondroitin sulfate proteoglycan (CSPG) in reactive astrocytes in control-AAV infected injury sites (upper panels, arrowheads; 7 dpi), whereas NeuroD1-infected areas showed significantly reduced CSPG signal (lower panels). Scale bar = 200 μm (low mag, left), 10 μm (high mag, right). Bar graph showing quantitative analysis of the CSPG signal in control and NeuroD1 groups. n = 3 mice. Each dot represents one animal. *P < 0.05, Student’s t-test.
