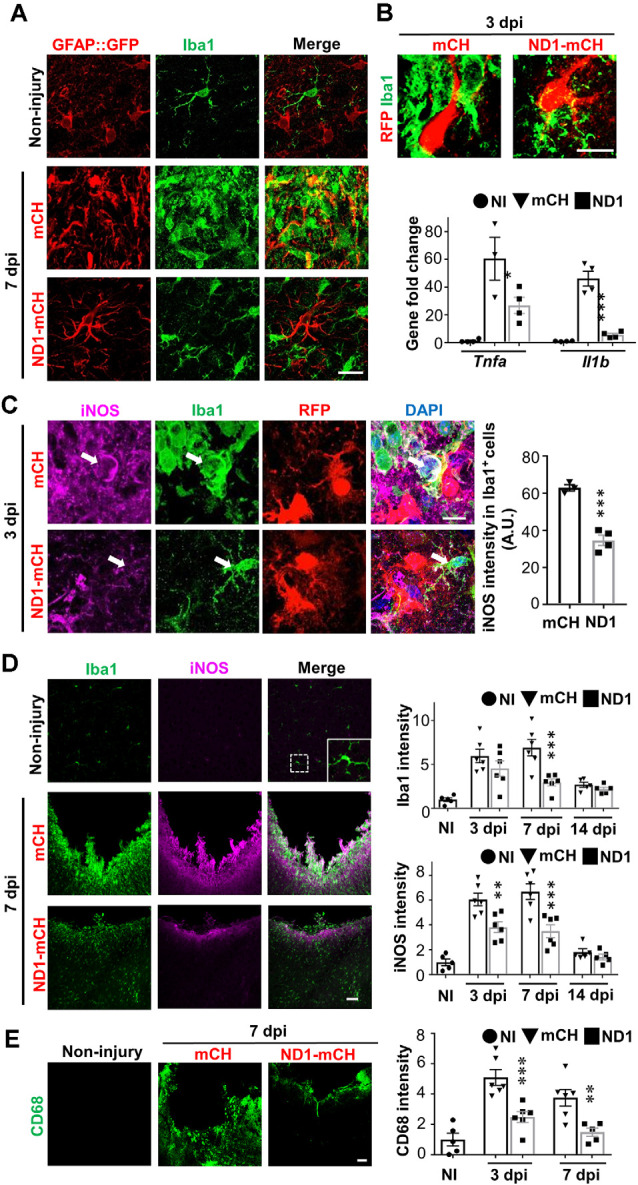
Figure 4.

NeuroD1-treatment attenuates microglial inflammatory responses. (A) Microglia (Iba1, green) in non-injured brains displaying ramified branches (top row), but showing hypertrophic amoeboid shape in stab-injured areas (middle row, 7 dpi). In NeuroD1-infected injury areas, however, microglia returned to ramified morphology again (bottom row). Such morphological changes of microglia coincided with the morphological changes of astrocytes (GFAP::GFP labeling in the left column). Scale bar = 20 μm. (B) Representative images showing a close look of the microglia morphology (Iba1, green) contacting mCherry-infected astrocytes (left panel, red) or NeuroD1-mCherry infected astrocytes (right panel, red) at 3 dpi. Note that microglia showed clear morphological difference when contacting the NeuroD1-infected astrocytes as early as 3 dpi. Scale bar = 20 μm. Lower bar graph illustrating the gene expression level of inflammatory factors Tnfa and Il1b significantly increased in stab-injured cortices compared to non-injured cortical tissue, but such increase was greatly reduced in NeuroD1-infected injury areas (3 dpi). n = 4 mice. Each dot represents one animal. *P < 0.05, ***P < 0.001, one-way ANOVA followed with Sidak’s test. (C) Representative images illustrating many inflammatory M1 microglia labeled by nitric oxide synthase (iNOS) with amoeboid morphology in the control-AAV infected injury areas (upper panels, 3 dpi). In contrast, microglia in close contact with the NeuroD1-infected astrocytes showed much lower iNOS expression with ramified morphology (lower panels, arrow; 3 dpi). Scale bar = 10 μm. Quantitative analysis showing a significant reduction of the iNOS signal of Iba1+ cells in close contact with NeuroD1-infected cells. n = 3–4 mice per group. Each dot represents one animal. ***P < 0.001, Student’s t-test. (D) Representative images illustrating lack of iNOS signal in non-injured brains (upper panels), but high Iba1 and iNOS signal in stab-injured cortical tissue (middle panels, 7 dpi). However, in NeuroD1-infected cortices, both Iba1 and iNOS signals reduced significantly (bottom panels, 7 dpi). Scale bar = 50 μm. Right bar graphs, quantitative analyses showing the immunofluorescent signal of Iba1 and iNOS in non-injured (white bar), mCherry control (black bar), or NeuroD1 AAV-infected cortices (gray bar) at 3, 7, and 14 dpi. **P < 0.01, ***P < 0.001. Two-way ANOVA followed by Bonferroni post hoc tests. n = 5–6 mice per group. Each dot represents one animal. (E) Representative images showing the immunoreactivity of CD68, a macrophage marker, significantly reduced in NeuroD1-infected cortical tissues. Scale bar = 50 μm. Right bar graph showing a quantitative analysis result, which revealed a significant reduction of CD68 fluorescent signals in NeuroD1-infected cortices (gray bar) at 3 and 7 dpi. n = 5–6 mice per group. Each dot represents one animal. **P < 0.01, ***P < 0.001, two-way ANOVA plus Bonferroni post hoc test.
