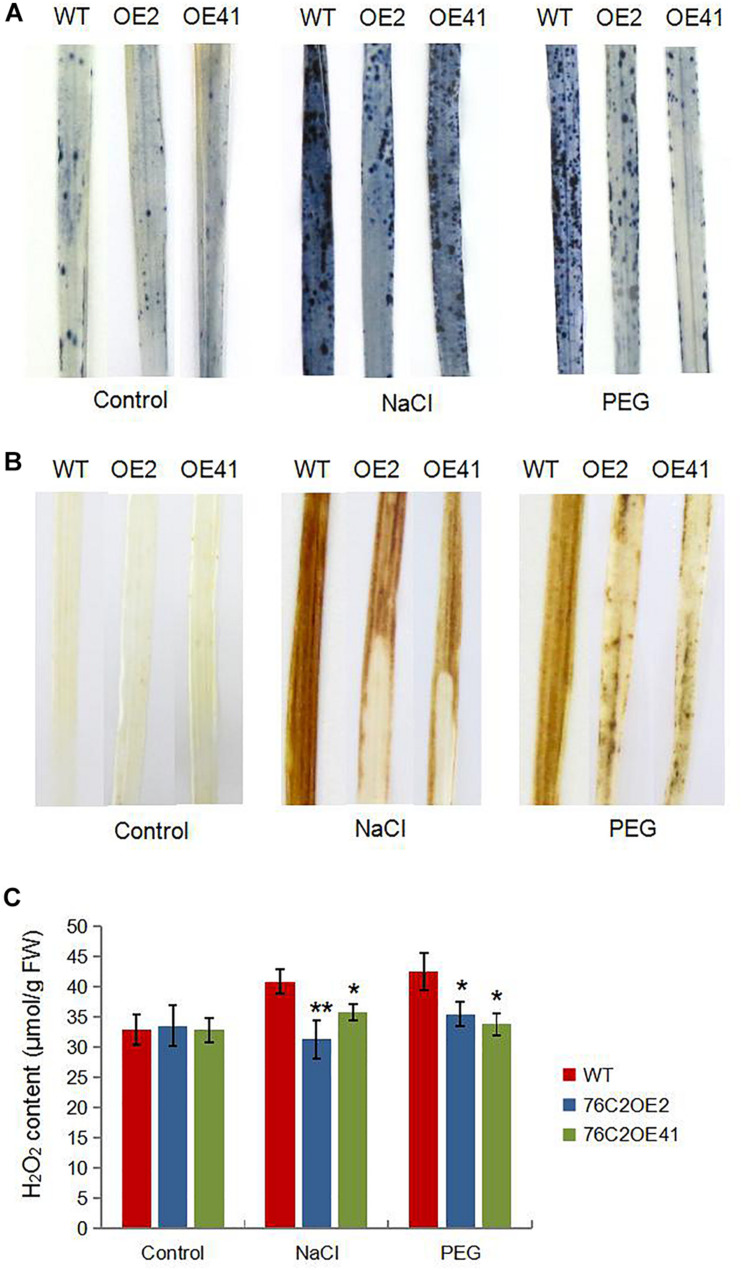
FIGURE 7.
ROS production in the transgenic plants in response to salt and drought conditions. Four-week-old WT and AtUGT76C2 overexpression rice plants were subjected to 200 mM NaCI and 15% PEG8000 treatments for 12 h, respectively. Then rice leaves were subjected to NBT (A) and DAB staining (B), and H2O2 contents were quantitatively measured (C). For each staining and H2O2 determination, leaves were harvested from at least five independent plants, and the pictures were representative of most samples. Asterisks indicate significant differences between wild type and the overexpression lines evaluated with Student’s t-test (*P < 0.05, **P < 0.01).

