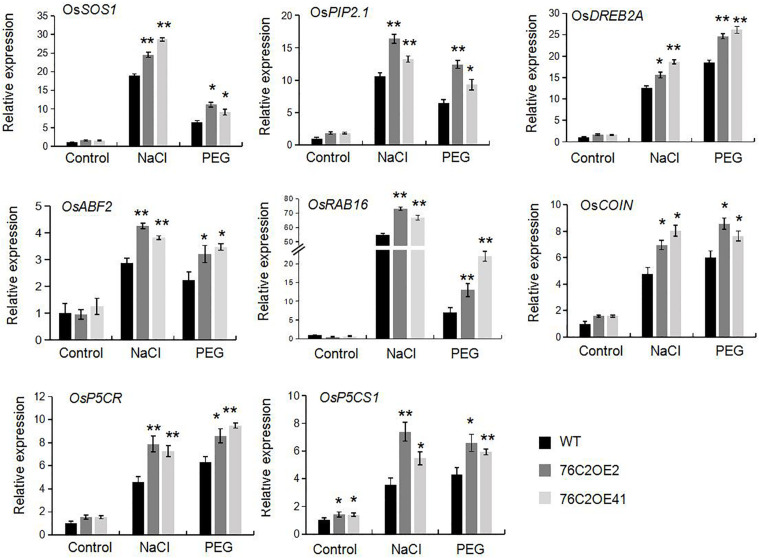
FIGURE 9.
Expression of abiotic stress related genes in wild type, UGT76C2 overexpression plants in response to stresses. The experiments included three biological replicates, each with three technical replicates. Asterisks indicate significant differences between the wild type and the overexpression lines evaluated with Student’s t-test (*P< 0.05, **P < 0.01).

