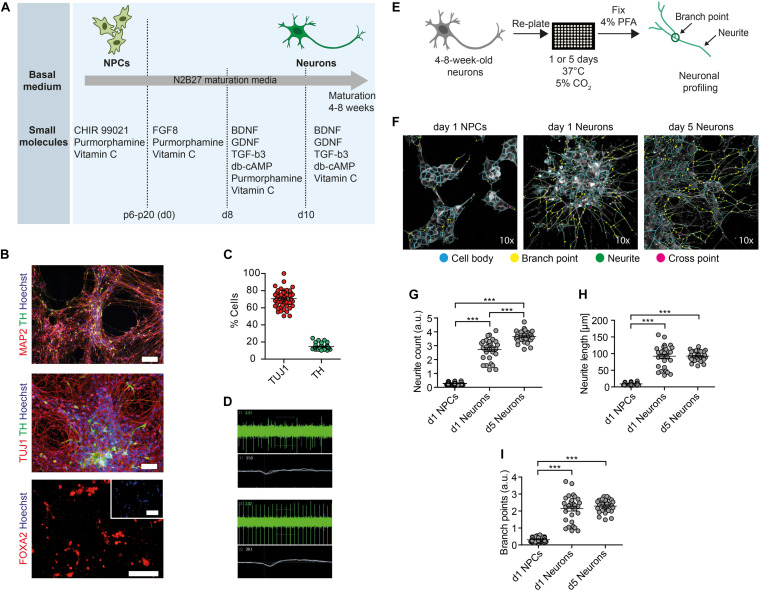
FIGURE 1.
Generation of functional DNs and HCI-based neuronal profiling. (A) Schematics of the iPSC-based generation of NPCs and DNs, indicating the time-points of different media formulations. (B) 4- to 8-week-old DNs generated from control iPSCs (XM001 line) expressed the neuronal marker TUJ1 and MAP2, and the DA-specific markers FOXA2 and TH. Scale bar: 100 μm. (C) HCI-based quantification of control DNs (XM001) expressing TUJ1 and TH at 8 weeks of culture (mean ± SEM). Each dot represents mean values (% neuronal cells) from one well. (D) Representative recordings (spike plot and wave plot) of network-based electrophysiological properties of control DNs after 8 weeks in culture using MEA. (E) Schematic workflow of HCI-based neuronal profiling analysis. (F) Representative images of NPCs and DNs (at 4–8 weeks of differentiation) fixed after day 1, and of DNs fixed after day 5. Cell bodies depicted in blue, branch points in yellow, neurites in green, and cross points in magenta. All images were taken at 10× magnification. (G–I) Quantification of neurite count (G), neurite length (H), and branch points (I) in NPCs and 4- to 8-week-old DNs at day 1 and day 5 after re-plating (30 technical replicates for DNs and 60 technical replicates for NPCs; each dot represents the value obtained from one well; mean ± SEM; ***p < 0.001; one-way ANOVA followed by Dunnett’s multiple comparison test).

