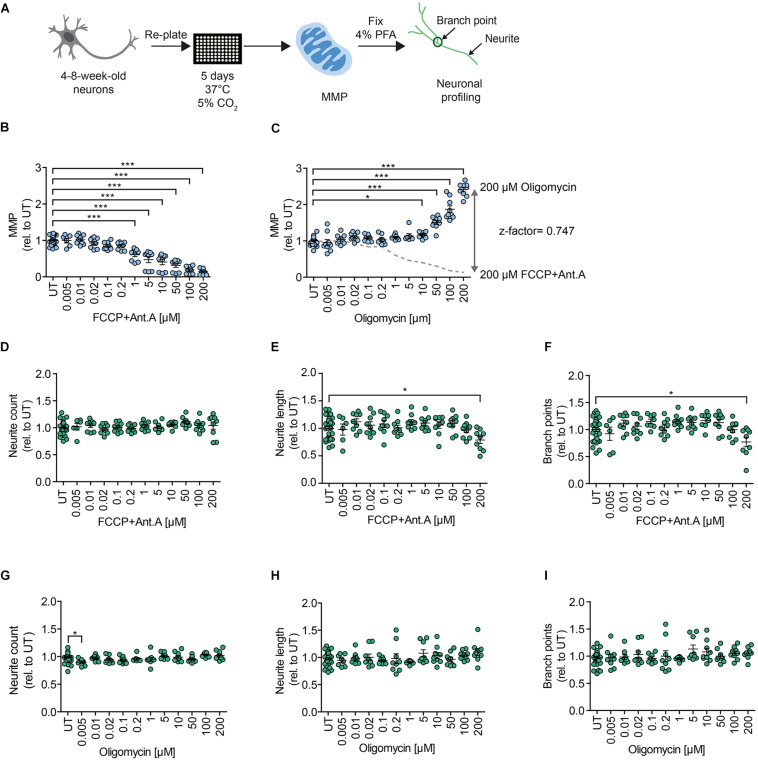
FIGURE 2.
MNH assay development. (A) Schematics of the MNH assay. (B) Quantification of MMP in 4- to 8-week-old DNs derived from hESCs (H1 line) treated with increasing concentrations of FCCP and Ant.A (0.005–200 μM). Each dot represents the average of the values obtained from one well normalized to the corresponding untreated (UT) control exposed to the assay media only (n = 3 independent experiments; mean ± SEM; ***p < 0.001; one-way ANOVA followed by Dunnett’s multiple comparison test). (C) Quantification of MMP in 4- to 8-week-old DNs from control hESCs (H1 line) treated with increasing concentrations of oligomycin (0.005–200 μM; mean ± SEM; *p < 0.05, ***p < 0.001; one-way ANOVA followed by Dunnett’s multiple comparison test). Each dot represents the average of values obtained from one well normalized to the corresponding UT control exposed to the assay media only (n = 3 independent experiments). Assessment of the z-factor of 0.747 obtained at 200 μM FCCP and 200 μM Ant.A versus 200 μM Oligomycin suggesting an excellent assay. (D–F) Quantification of neurite count (D), neurite length (E), and branch points (F) in 4- to 8-week-old DNs from hESCs (H1 line) treated with increasing concentrations of FCCP and Ant.A (0.005–200 μM; mean ± SEM; *p < 0.05; one-way ANOVA followed by Dunnett’s multiple comparison test). Each dot represents values obtained from one well (n = 3 independent experiments), normalized to the corresponding UT controls exposed to the assay media only. (G–I) Quantification of neurite count (G), neurite length (H), and branch points (I) in 4- to 8-week-old DNs from hESCs (H1) treated with increasing concentrations of oligomycin (0.005–200 μM; mean ± SEM; *p < 0.05; one-way ANOVA followed by Dunnett’s multiple comparison test). Each dot represents values obtained from one well (n = 3 independent experiments), normalized to the corresponding UT controls exposed to the assay media only.

