FIGURE 4.
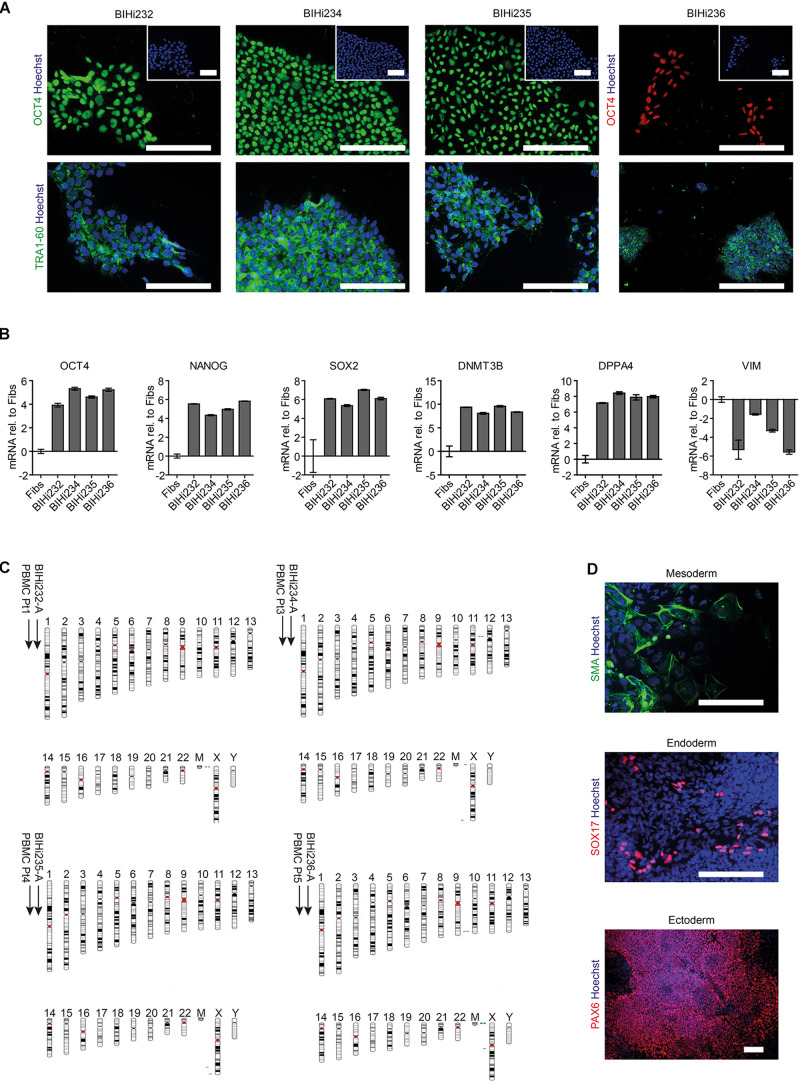
Generation of patient-specific AUD-iPSCs. (A) Representative immunostaining images of pluripotency-associated markers OCT4 and TRA1-60 in AUD-patient derived iPSCs (BIHi232, BIHi234, BIHi235, and BIHi236). We counterstained the cells using Hoechst. Scale bar: 100 μm. (B) Quantitative real-time RT-PCR analysis of pluripotency-associated markers in AUD-iPSCs (BIHi232, BIHi234, BIHi235, and BIHi236) relative to fibroblasts (Fibs; CON2). Relative transcript levels of each gene were calculated based on the 2–ΔΔCT method. Data were normalized to the housekeeping gene GAPDH and are presented as mean LOG2 ratios in relation to fibroblasts (mean ± SD). (C) Single nucleotide polymorphism (SNP)-based virtual karyotype of AUD-iPSCs. We compared the karyotype of the iPSCs to the corresponding parental cells (peripheral blood mononuclear cells, PBMCs). We did not see any larger areas of insertions or deletions. Green: area with genomic gain; red: with genomic loss; gray: area with loss of heterozygosity. Pt, patient. (D) Representative immunostaining images of AUD-iPSCs differentiated into cells belonging to the three germ layers: mesoderm (smooth muscle actin, SMA), endoderm (SOX17), and ectoderm (PAX6). Scale bar: 100 μm.

