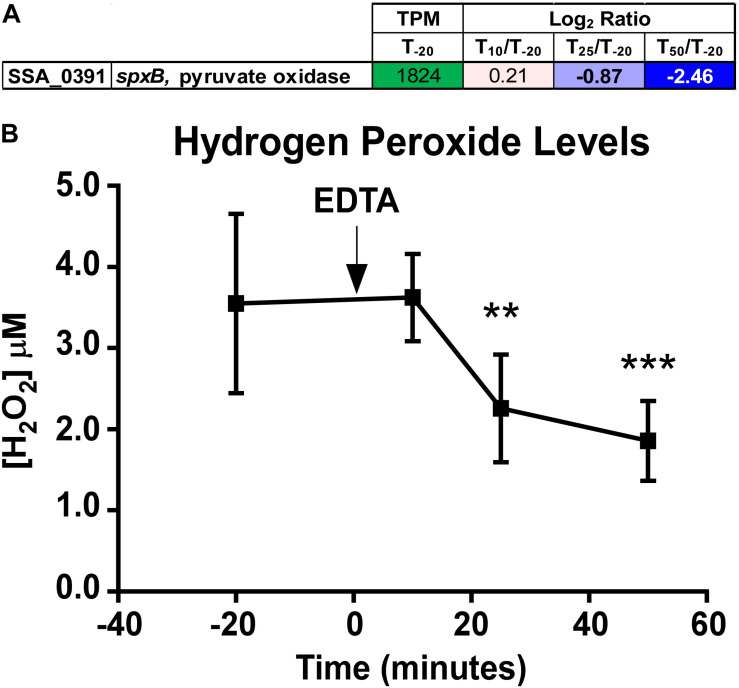
FIGURE 6.
Quantitation of spxB expression and hydrogen peroxide in ΔssaACB fermentor cultures. (A) Expression of the spxB gene in fermentor-grown ΔssaACB cells as determined by RNA-seq analysis. Average TPM at T–20 and log2 fold change values for each after Mn depletion time point are displayed. TPM values greater than 1,000 are full saturation (green). Positive log2 fold change values (red) are genes upregulated in after Mn depletion samples as compared to T–20, while negative values (blue) indicate downregulated genes. Values in bold indicate significant changes in expression by adjusted P-value (≤0.05). (B) H2O2 levels of the BHI culture supernatant were measured at each time point. Means and standard deviations of at least four replicates are shown. Significance was determined by one-way ANOVA with a Tukey-Kramer multiple comparisons test, comparing each post-EDTA time point to T–20. **P ≤ 0.01, ***P ≤ 0.001.

