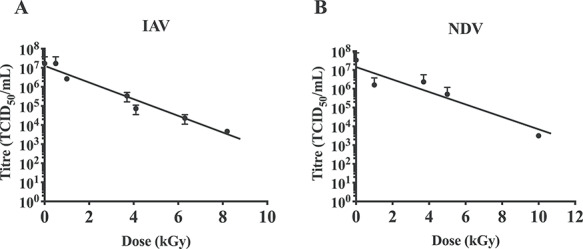
Fig. 2.

Log–linear inactivation curves of ssRNA viruses in allantoic fluid. (A) Influenza A virus and (B) Newcastle disease virus were exposed to increasing doses of γ-irradiation on dry ice. Reduced virus titre (as measured by TCID50/ml) for increasing irradiation doses helped to generate inactivation curves and log–linear inactivation was observed for both viruses. Data are expressed as mean ± SEM (n = 2). Horizontal dashed line represents background binding of virus to RBCs in the absence of a cell monolayer.
