
Fig. 3.
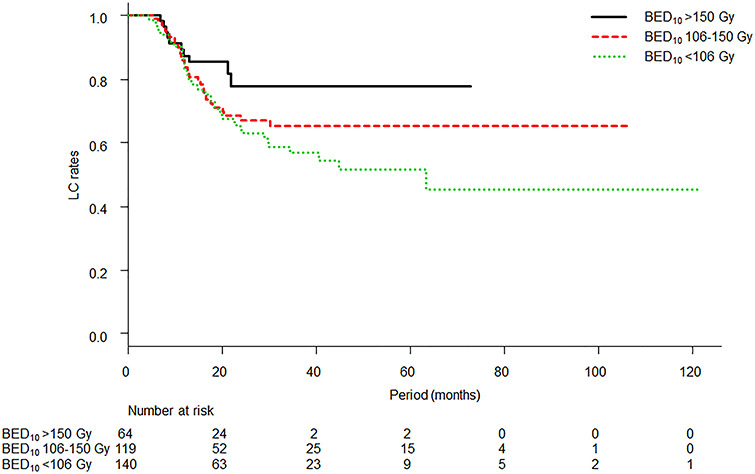
Kaplan–Meier curves of LC according to group separation: classic standard SBRT dose or less group (BED10 < 106 Gy), higher than standard dose but less than ablative dose group (BED10 106–150 Gy) and ablative dose group (BED10 > 150 Gy). The 3-year LC rates of each group were 57.0% (95% CI: 46.4–66.3%), 65.3% (95% CI: 54.1–74.4%) and 77.7% (95% CI: 61.0–88.0%), respectively. A log-rank test for the three curves was not significant (P = 0.13).