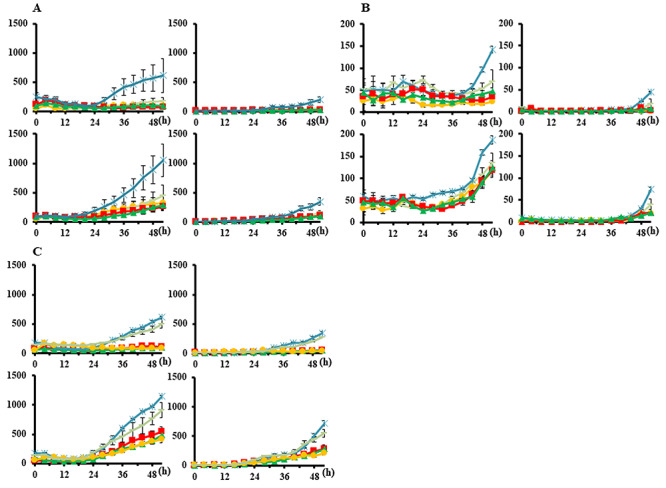
Fig. 5.

Proportions of dead and apoptotic cells per cell area irradiated with proton beams. Bars represent the SD of three experiments. circle, 0 μM; square, 0.25 μM; triangle, 0.5 μM; −, 1.5 μM; asterisk, 2.5 μM. (A) HSG, (B) EMT6 and (C) V79. The vertical axis indicates the number of counts per cell area on the image taken. The horizontal axis represents time (h). Left columns, cell death; right columns, apoptosis. Upper rows, 2-GyE group; lower rows, 5-GyE group.
