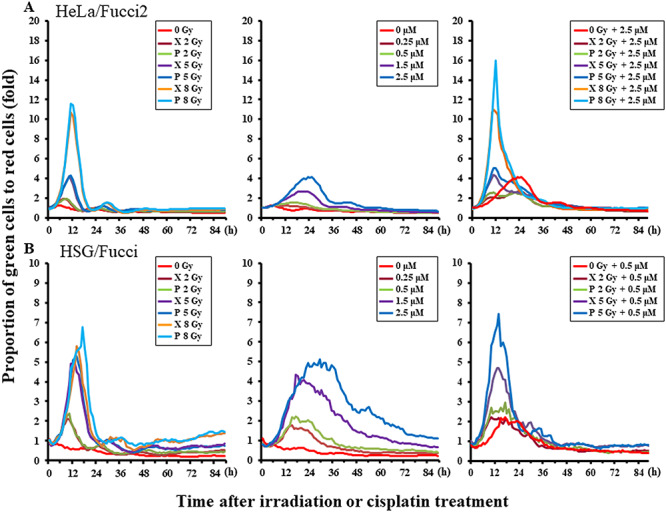
Fig. 6.

Curves representing the ratio of green S/G2/M phase cells to red G1 phase cells after irradiation. (A) HeLa/Fucci2, (B) HSG/Fucci. Left panels, radiation alone; middle panels, cisplatin alone; and right panels, radiation combined with cisplatin. The groups of HSG/Fucci irradiated at 8 Gy or 8 GyE combined with 0.5 or 2.5 μM cisplatin were excluded from the right panels because the cell killing effect was too strong.
