
Fig. 6.
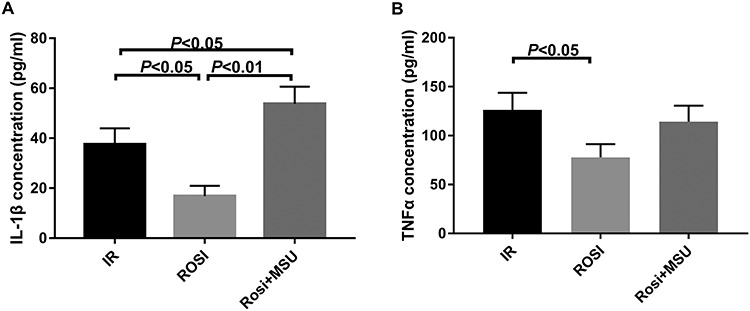
The concentration of IL-1β and TNF-α in control, rosiglitazone and rosiglitazone + MSU groups. (A) IL -1β expression level; (B) TNF-α expression level. Each experiment was repeated at least three times (one-way ANOVA followed by a Tukey–Kramer multiple comparisons post test).