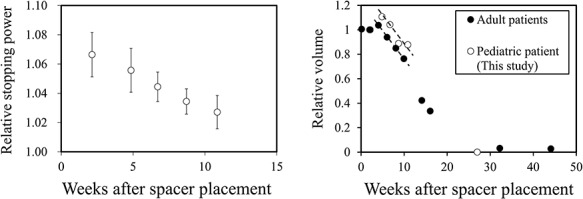
Fig. 4.

Left panel: changes in the relative stopping power of the PGA spacer placed in a pediatric patient. Right panel: changes in the relative volume of the PGA spacer implanted into adult patients (black circles, plotted from ref. [16]) and the pediatric patient (white circles). The broken lines indicate the volume reduction rate for adult patients.
