FIGURE 3.
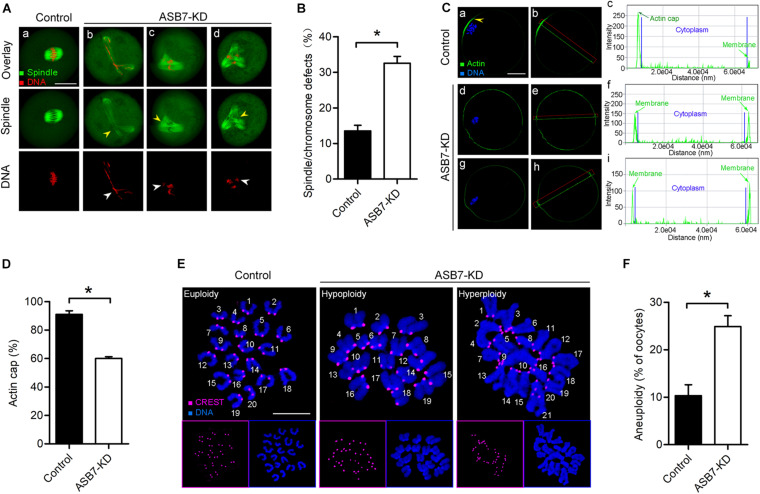
Depletion of ASB7 in oocytes disrupts cytoskeletal organization. (A) Control and ASB7-KD oocytes were stained with α-tubulin antibody to visualize spindle (green) and counterstained with PI to visualize chromosome (red). (a) Control oocytes show a representative barrel-shaped spindle and well-aligned chromosomes; (b–d) Disorganized spindles (yellow arrowheads) and misaligned chromosomes (white arrowheads) were readily observed in ASB7-KD oocytes. Scale bar: 30 μm. (B) Quantification of control (n = 140) and ASB7-KD (n = 152) with spindle/chromosome defects. (C) Metaphase oocytes were labeled with phalloidin to visualize actin (green) and counterstained with Hoechst 33342 for chromosomes (blue). Arrowhead shows the position of the actin cap in control oocytes. Profiles of actin fluorescence intensity along the green line in corresponding images are shown in the right panel (c,f,i). Scale bar: 30 μm. (D) Quantification of control (n = 32) and ASB7-KD (n = 35) with normal actin cap formation. (E) Chromosome spread of control and ASB7-KD MII oocytes. Chromosomes were stained with Hoechst 33342 (blue), and kinetochores were labeled with CREST (purple). Representative confocal images show euploid control oocytes and aneuploid ASB7-KD oocytes. Scale bar: 10 μm. (F) Quantification of aneuploidy in control (n = 43) and ASB7-KD (n = 50) oocytes. Data are expressed as mean percentage ± SEM of three independent experiments. *p < 0.05 vs controls.

