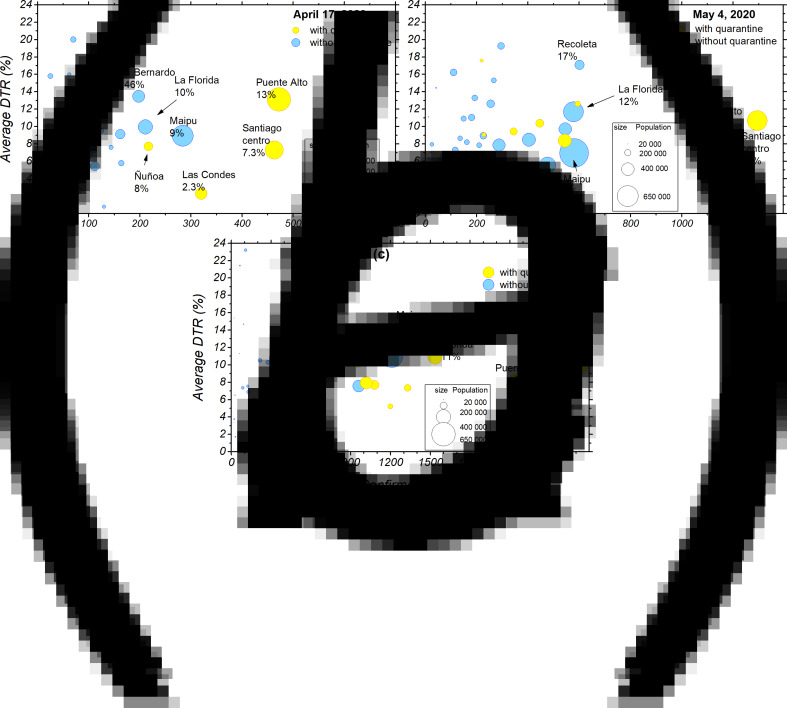
Fig. 5.
Progression of the confirmed cases, population and DTR for the different communes from 17 April to 15 May. (a) Average DTR as a function of the number of confirmed cases according to commune population size as of 17 April. Communes that were in quarantine are represented in yellow circles, and communes that were not under quarantine are represented by blue circles. (b) Average DTR as a function of the number of confirmed cases according to commune population size as of 4 May. (c) Average DTR as a function of the number of confirmed cases according to commune population size as of 15 May.

