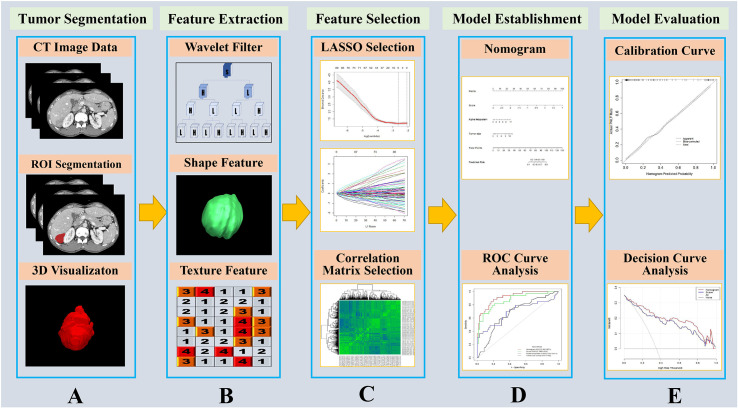
Figure 1.
Flow chart of the study. (A) The portal vein contrast-enhanced computed tomography (CECT) image was used as input, and the liver was segmented by homemade segmentation software (22) and manually corrected. The tumor ROI was contoured by a radiologist with more than 10 years of experience. (B) The liver parenchyma without tumor was set as the ROI image, and features containing as shape related features, texture related features and wavelet filtered features which were extracted by PyRadiomics software (23). (C) The extracted features were reduced via least absolute shrinkage and selection operator (LASSO) and correlation matrix selection. (D) The radiomics features and other clinicopathological variables were applied to establish a nomogram for predict microvascular invasion, and ROI curve analysis was conducted. (E) The nomogram model was evaluated with calibration curve and decision curve analysis.

