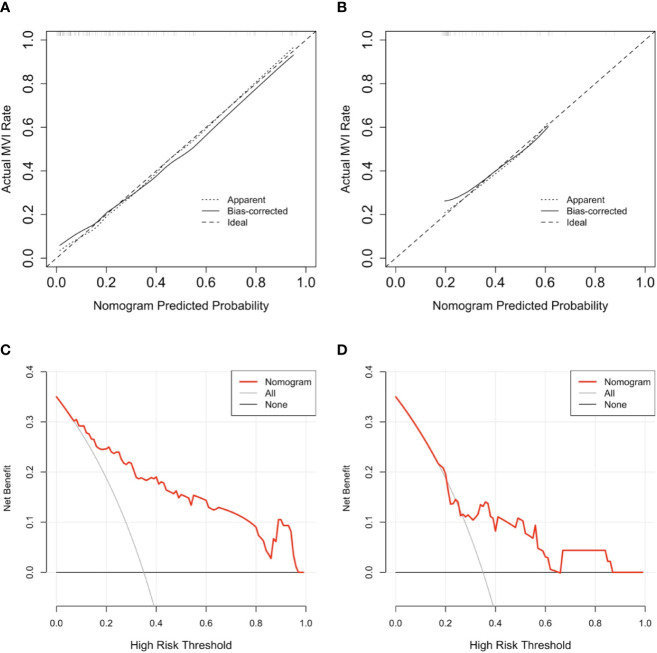
Figure 4.
The result of calibration curve analysis as well decision curve analysis for the purposed nomogram. (A, B) show the calibration curves analysis for the nomogram in predicting whether tumors with microvascular invasion occurrence among training cohort as well as validation cohort, respectively. the dashed line stands for perfect prediction, the dotted line represents apparent estimates of predicted vs. observed values, meanwhile the solid line on behalf of bias correcting estimates employing 1,000 bootstrap sampling. (C, D) show the result of decision curve analysis for the nomogram in predicting whether tumors with microvascular invasion occurrence among training cohort as well as validation cohort, respectively. The result of decision curve analysis indicated that assume the threshold probability that is located in an interval of 0.2 to 0.86, microvascular invasion (MVI) prediction using the nomogram can give more net benefit than by treating either no or all patients in all cohorts.

