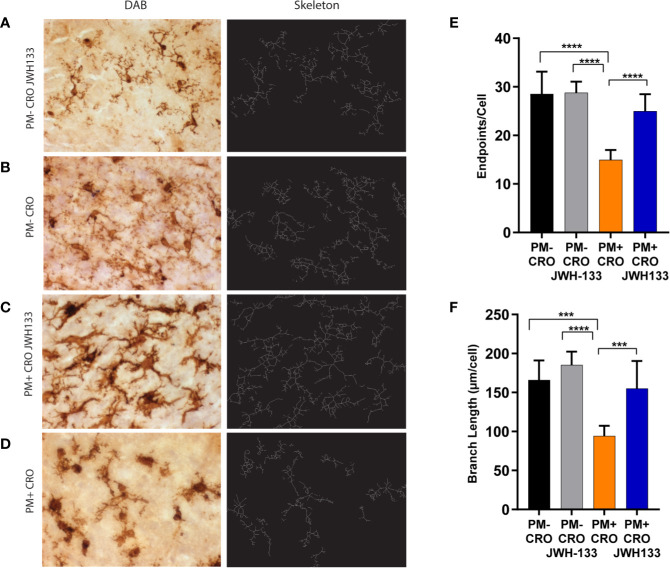
Figure 3.
Quantitative phenotypic analysis of microglial activation state on Iba-1 immuno-stained sections. Brain sections of animals from each experimental group, were immuno-stained for microglia using Iba-1 (pictures on the left, A–D). The digital image was skeletonized (pictures on the right, (A–D) and endpoints/cell (E) or summed branch length (F) were determined. In infected animals with ceftriaxone treatment (PM+ CRO), both parameters were significantly reduced compared to the others groups. In contrast, no differences between infected animals treated with JWH-133 (PM+ CRO/JWH133) and uninfected animals (PM-) could be observed. (PM- CRO, n = 3; PM- CRO/JWH133, n = 5; PM+ CRO, n = 11; PM+ CRO/JWH133, n = 6; one-way ANOVA with Tukey’s multiple comparison test: ***p < 0.001; ****p < 0.0001).

