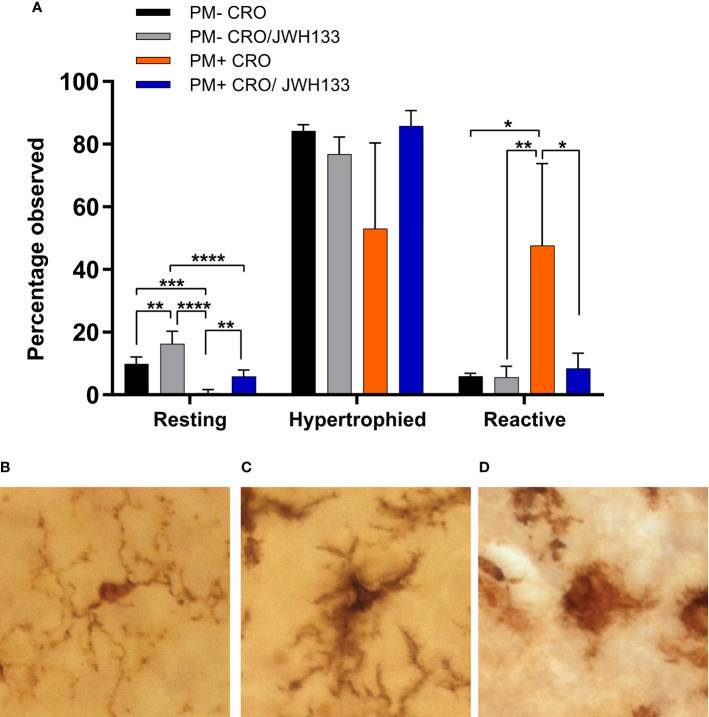
Figure 4.
Classification of microglia based on their morphology on Iba-1 immuno-stained sections. Significance differences in the proportion of the microglia classified in the categories “resting” and “reactive” were found between the experimental groups (A). Examples of microglia classified into the three different categories: resting = round, oval body with thin, long, and radially projecting processes (B); hypertrophied = enlarged and darkened cell bodies with thick processes and less branching (C); reactive = enlarged, darkened cell bodies with little to no processes observed (D). PM- CRO, n = 3; PM- CRO/JWH133, n = 4; PM+ CRO, n = 8; PM+ CRO/JWH133, n = 4; one-way ANOVA with Tukey’s multiple comparison test: *p < 0.05; **p < 0.01; ***p < 0.001; ****p < 0.0001.

