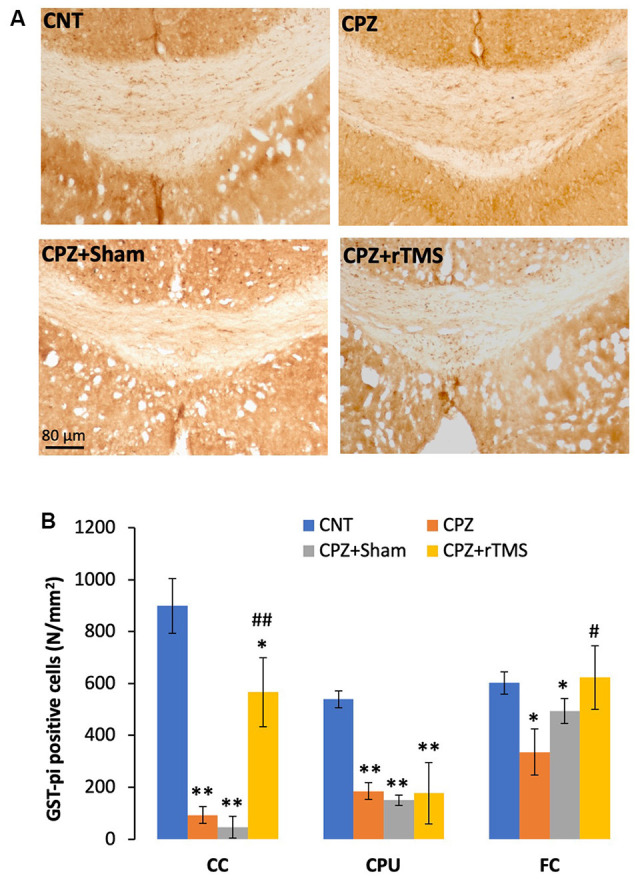
Figure 3.

rTMS alleviates OLs loss in corpus callosum (CC), caudate-putamen (CPU), and FC of CPZ-fed mice. (A) Representative images show glutathione-S-transferase (GST-π) positive cells in CC of mice from the four groups. (B) The bar chart shows the statistical analytic results of GST-π positive cell number in the three brain regions of the mice. Data are expressed as mean ± SD. N = 7/group. *p < 0.05, **p < 0.01, compared to CNT. #p < 0.05, ##p < 0.01, compared to CPZ.
