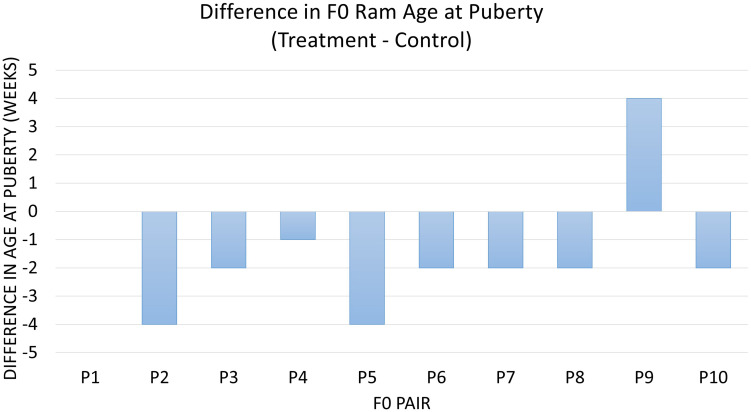
FIGURE 1.
The difference in age at puberty in all littermate pairs of F0 rams. Data are represented as treatment minus control in weeks of age at puberty. Diet was associated with age at puberty (P = 0.03), which differed by an overall average of –1.5 weeks in treatment vs. control pairs of animals. Pair 1 has a difference of 0.

