Figure 1.

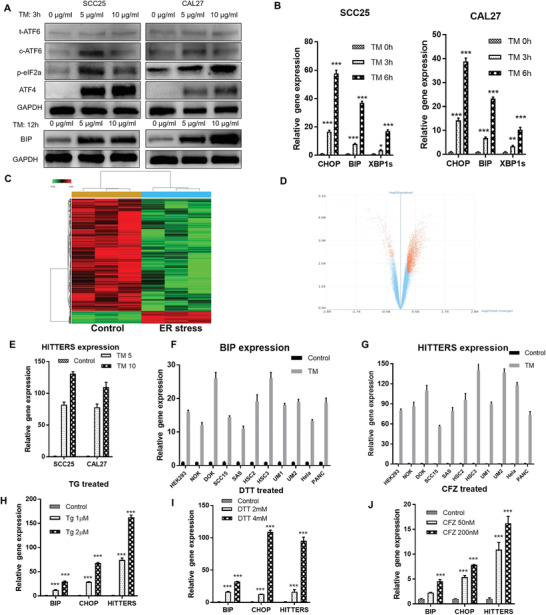
Identification of ER stress‐related lncRNAs. A) Western blot and B) qPCR confirmed that different concentrations of TM (5, 10 µg mL−1) or short time TM exposure could significantly induce ER stress of both SCC25 and CAL27 cells. C) Heatmap and D) volcano plot of HTA 2.0 lncRNA microarray for gene expression profiles of nontreated and TM‐treated SCC25 cells. E) qPCR confirmed the results of microarray that HITTERS was upregulated by treating cells with TM (5, 10 µg mL−1) for 6 h. F–J) qPCR showed F,G) treating different cells with TM (10 µg mL−1) for 6 h or H–J) treating SCC25 with different types of ER stress inducer for 6 h could upregulate both ER stress marker and HITTERS. The Student t‐test was used for analyzing the difference in (F) and (G). One‐way Analysis of Variance (ANOVA) test and Dunnett t‐test was used for (B), (E), and (H)–(J). For (E)–(G), all p < 0.001. Note: *, P < 0.05; **, P < 0.01, ***, P < 0.001.
