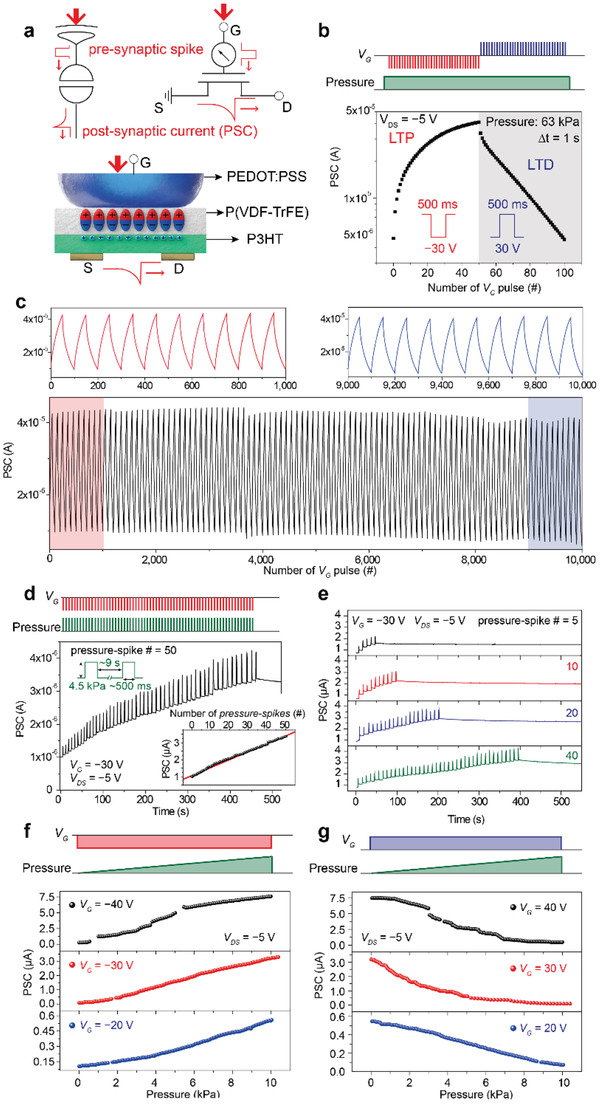
Figure 3.

Synaptic characteristics of the ATFES. a) Schematic of the signal transmission process between pre‐ and postneurons through the ATFES. The top insets show schematics of the tactile sensory receptor/synapse and corresponding circuit diagrams for the ATFES. b) LTP and LTD of the PSC as a function of the number of V G pulses of ±30 V for 500 ms at ≈63 kPa. c) Cycling transition between the LTP and LTD for the ATFES during continuous 10 000 V G pulses. d) Plot of the PSC response at V DS = −5V with respect to the 50 pressure‐spikes. Pressure = 4.5 kPa and V G = −30 V for ≈500 ms. The inset shows the PSC level as a function of the number of pressure‐spikes. e) Plots of the PSC responses with respect to the different number of pressure‐spikes (ranging from 5 to 40). The reading and programming voltages and their sequences are the same as in (d). f) LTP and g) LTD of the PSC of the ATFES as functions of the magnitude of pressure (from 5 × 10⁻² to 10 kPa) and the V G (= ±20, ±30, and ±40 V) .
