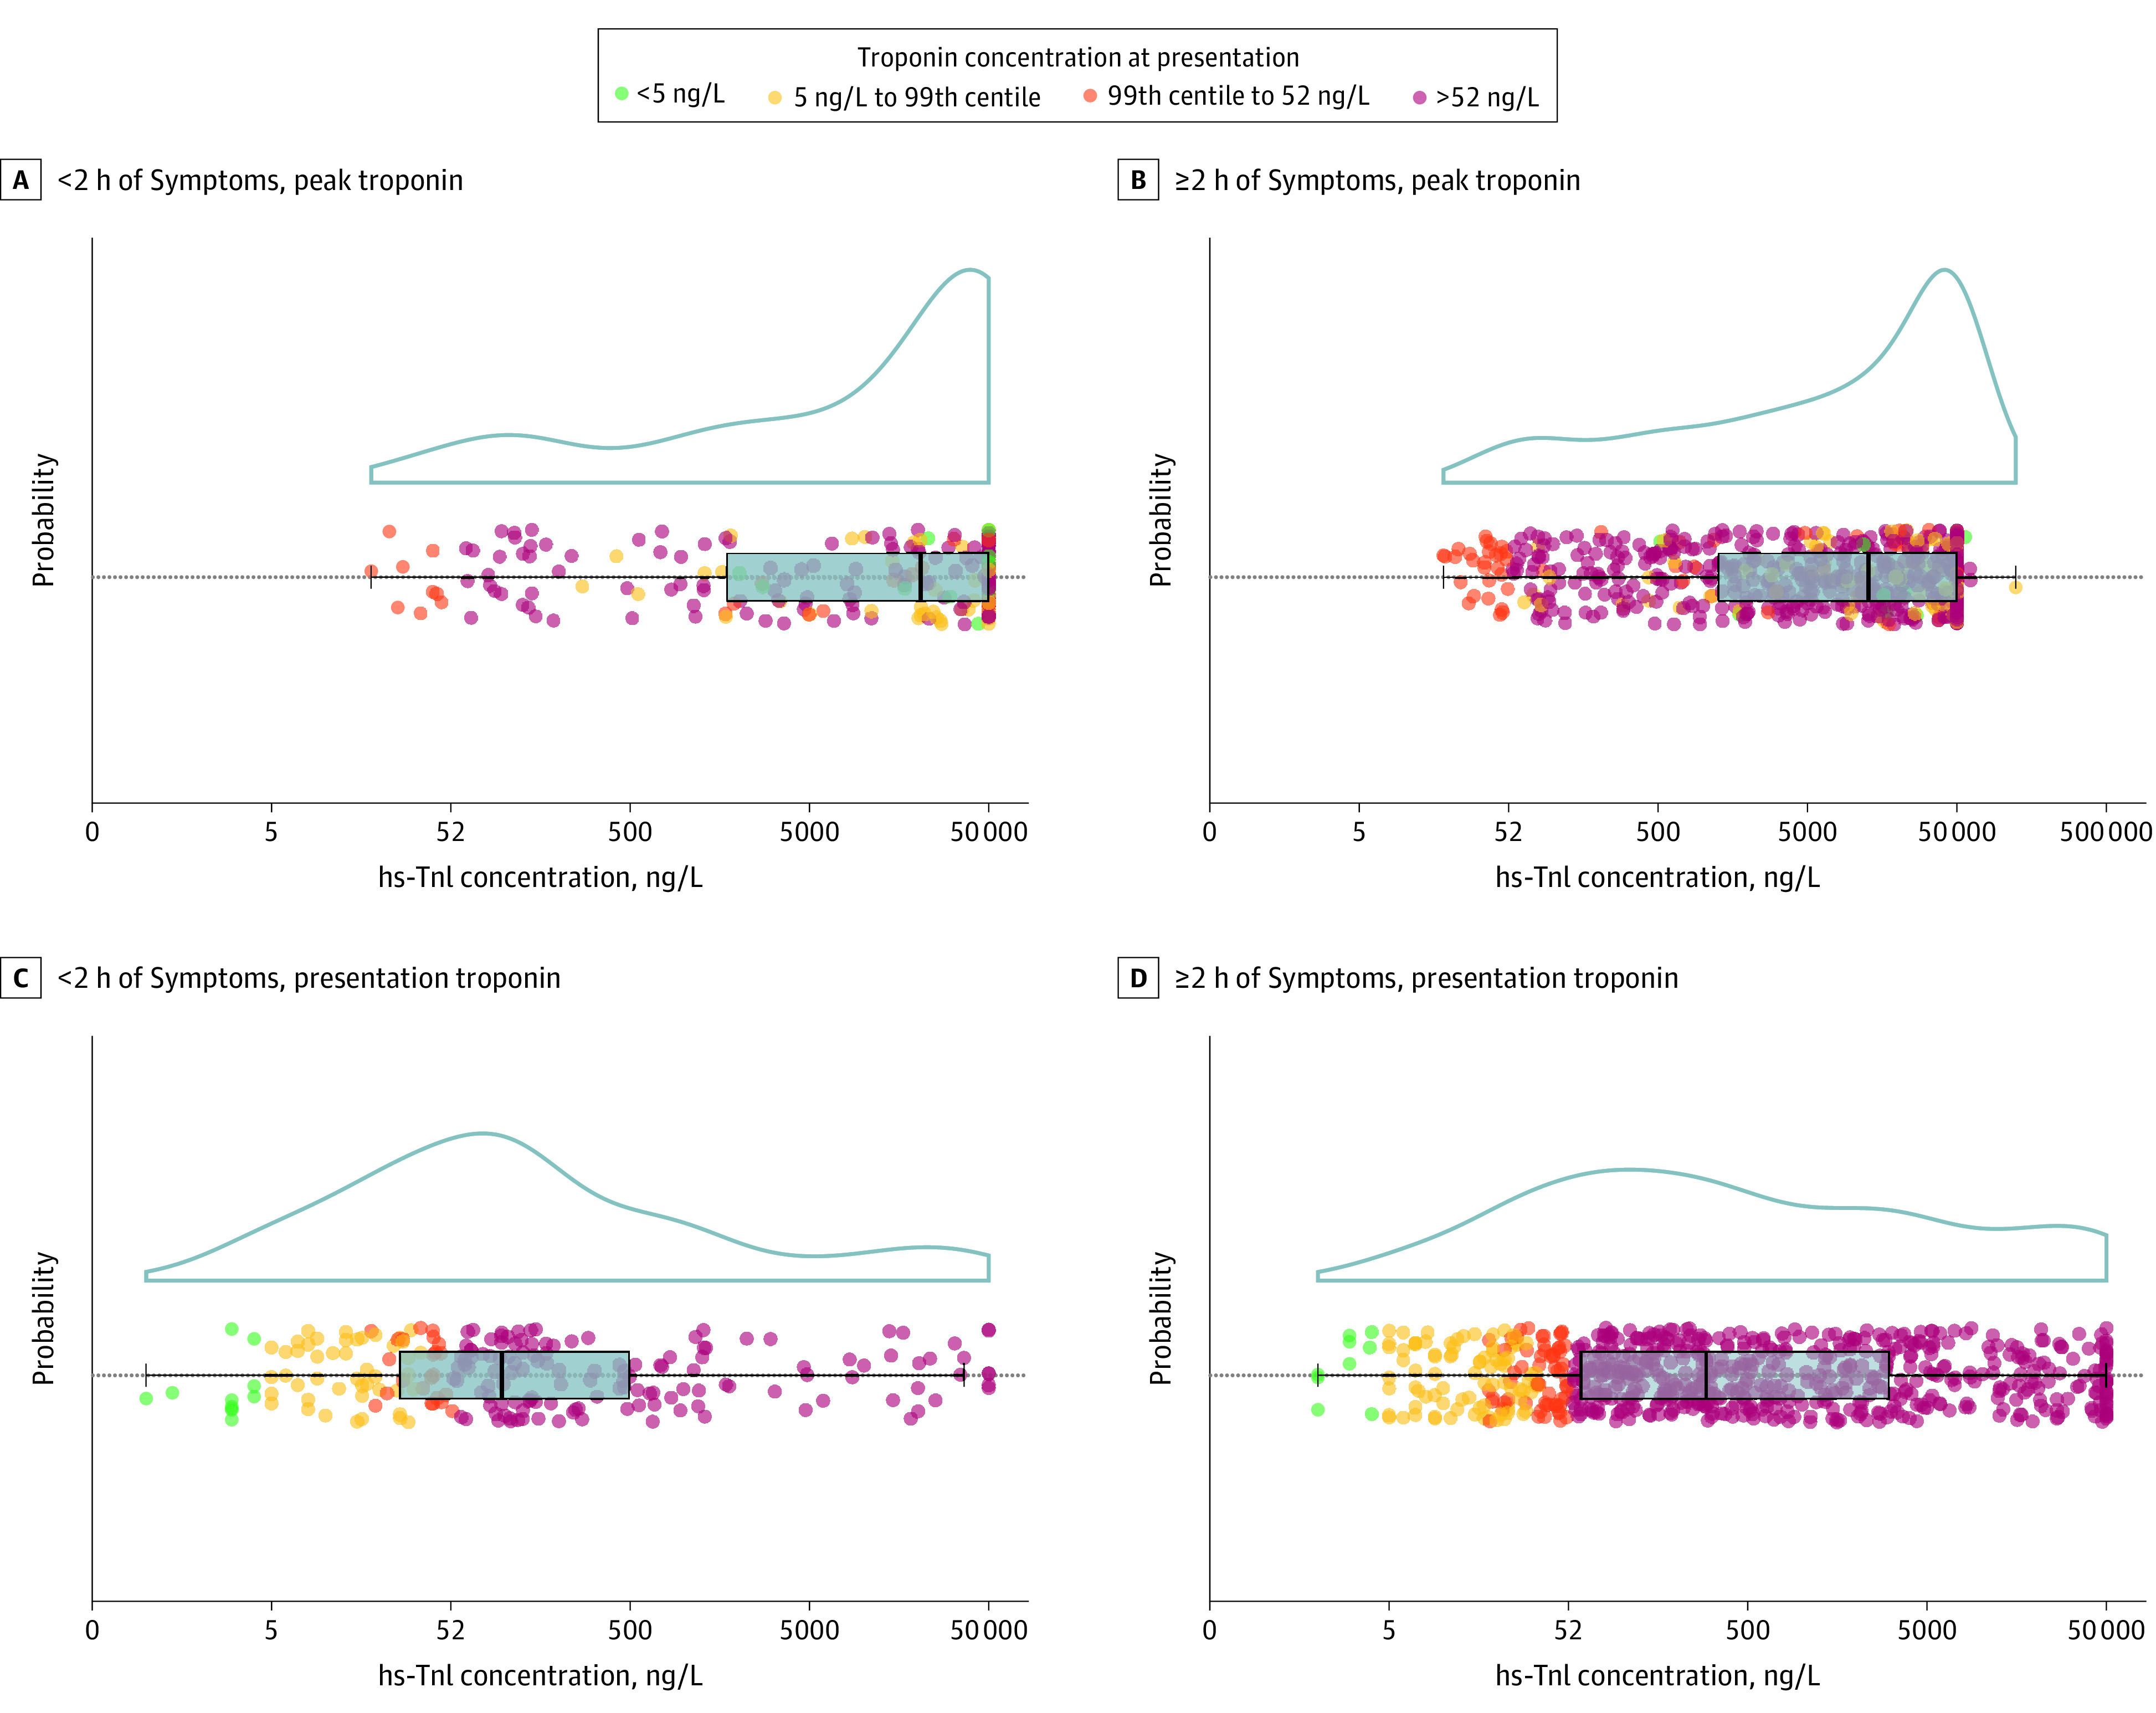
Figure. High-Sensitivity Cardiac Troponin I (hs-TnI) Concentrations in Consecutive Patients With ST-Segment Elevation Myocardial Infarction Stratified by Troponin Concentration at Presentation.

Patients were stratified by time of onset of symptoms (<2 hours and ≥2 hours) and according to cardiac troponin concentration at presentation. Individual patient concentrations (less than the rule-out threshold of <5 ng/L [green; to convert to micrograms per liter, multiply by 1], 5 ng/L to the 99th percentile diagnostic threshold [yellow], 99th percentile to 52 ng/L rule-in threshold for the ESC 0/1 hours pathway [orange], and >52 ng/L [red]) are shown with box and whisker distribution and probability density plots. Peak concentration is the highest troponin concentration obtained on serial sampling.
