
Figure 3. Facial Landmark Templates of Averaged Facial Images in Patients With Congenital Adrenal Hyperplasia (CAH) and Control Individuals.
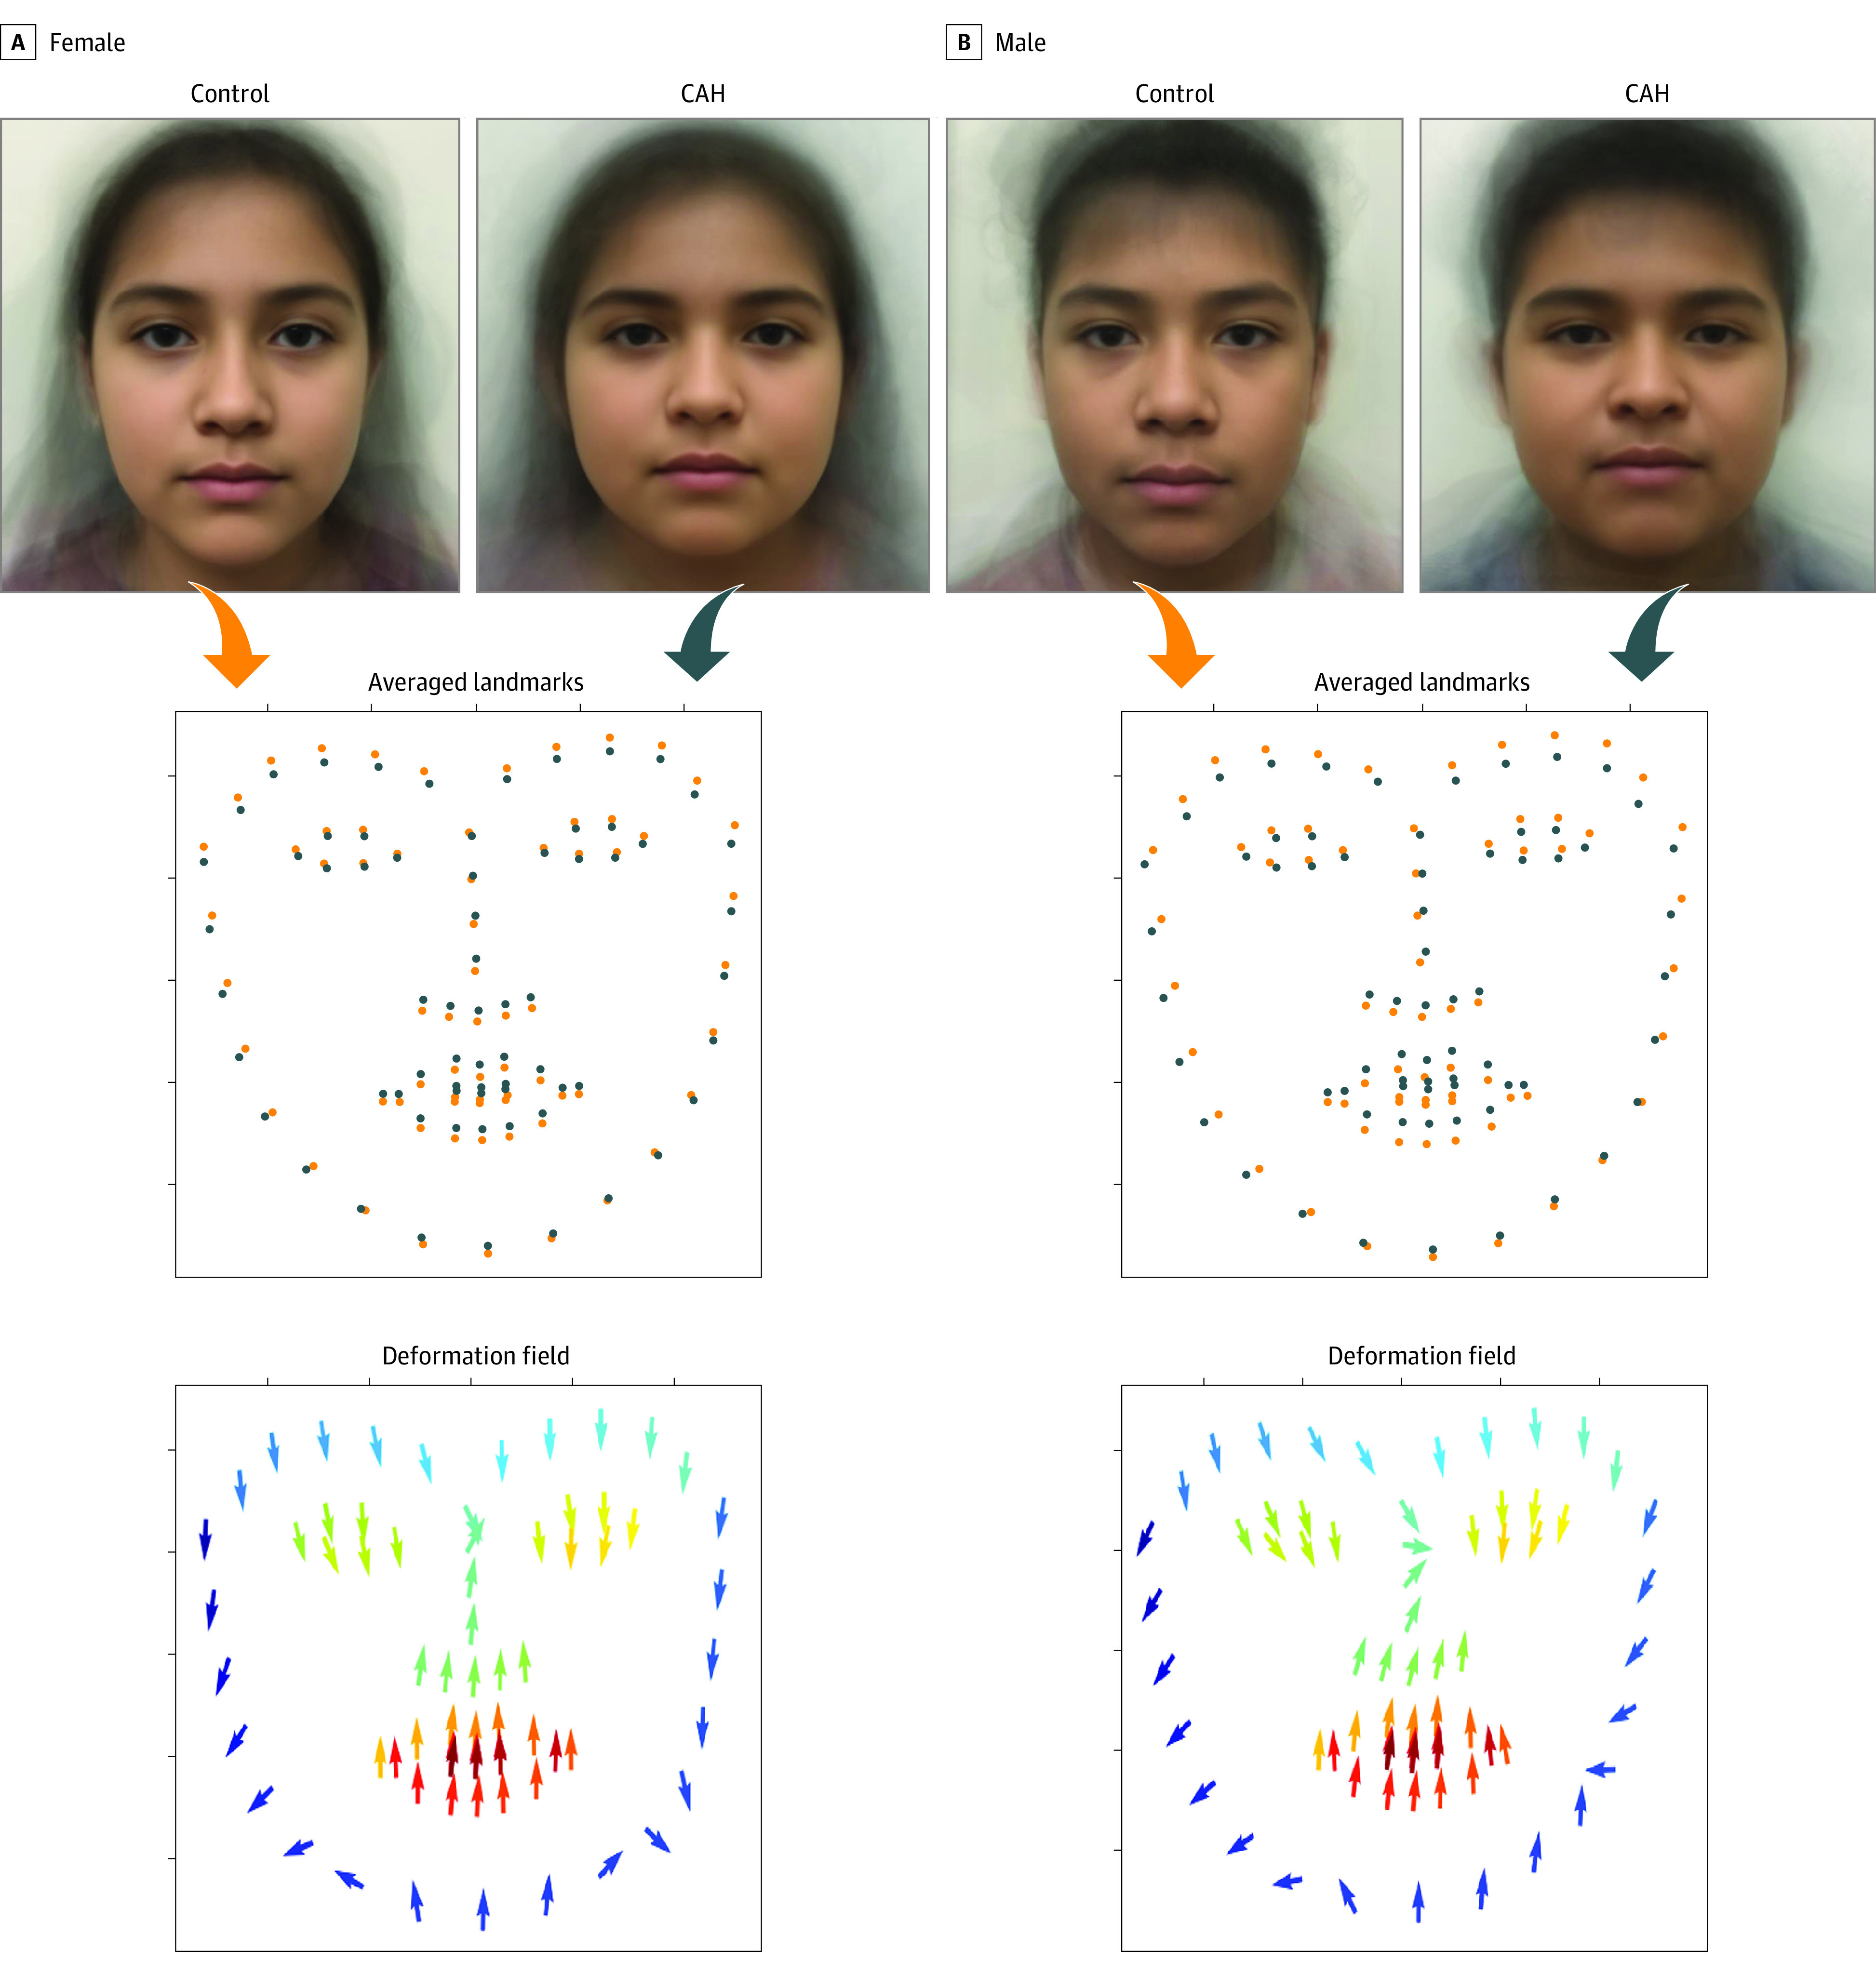
Top, The computer-generated averaged amalgam faces of patients with CAH and controls by sex are shown. The second row visualizes the overlaid 68 facial landmarks of the control group (orange) and the group with CAH (blue). The bottom row visualizes the deformation field introduced by CAH, with the direction of the arrows moving from facial landmarks of controls to those of patients with CAH. This deformation field helps interpret the averaged facial images.