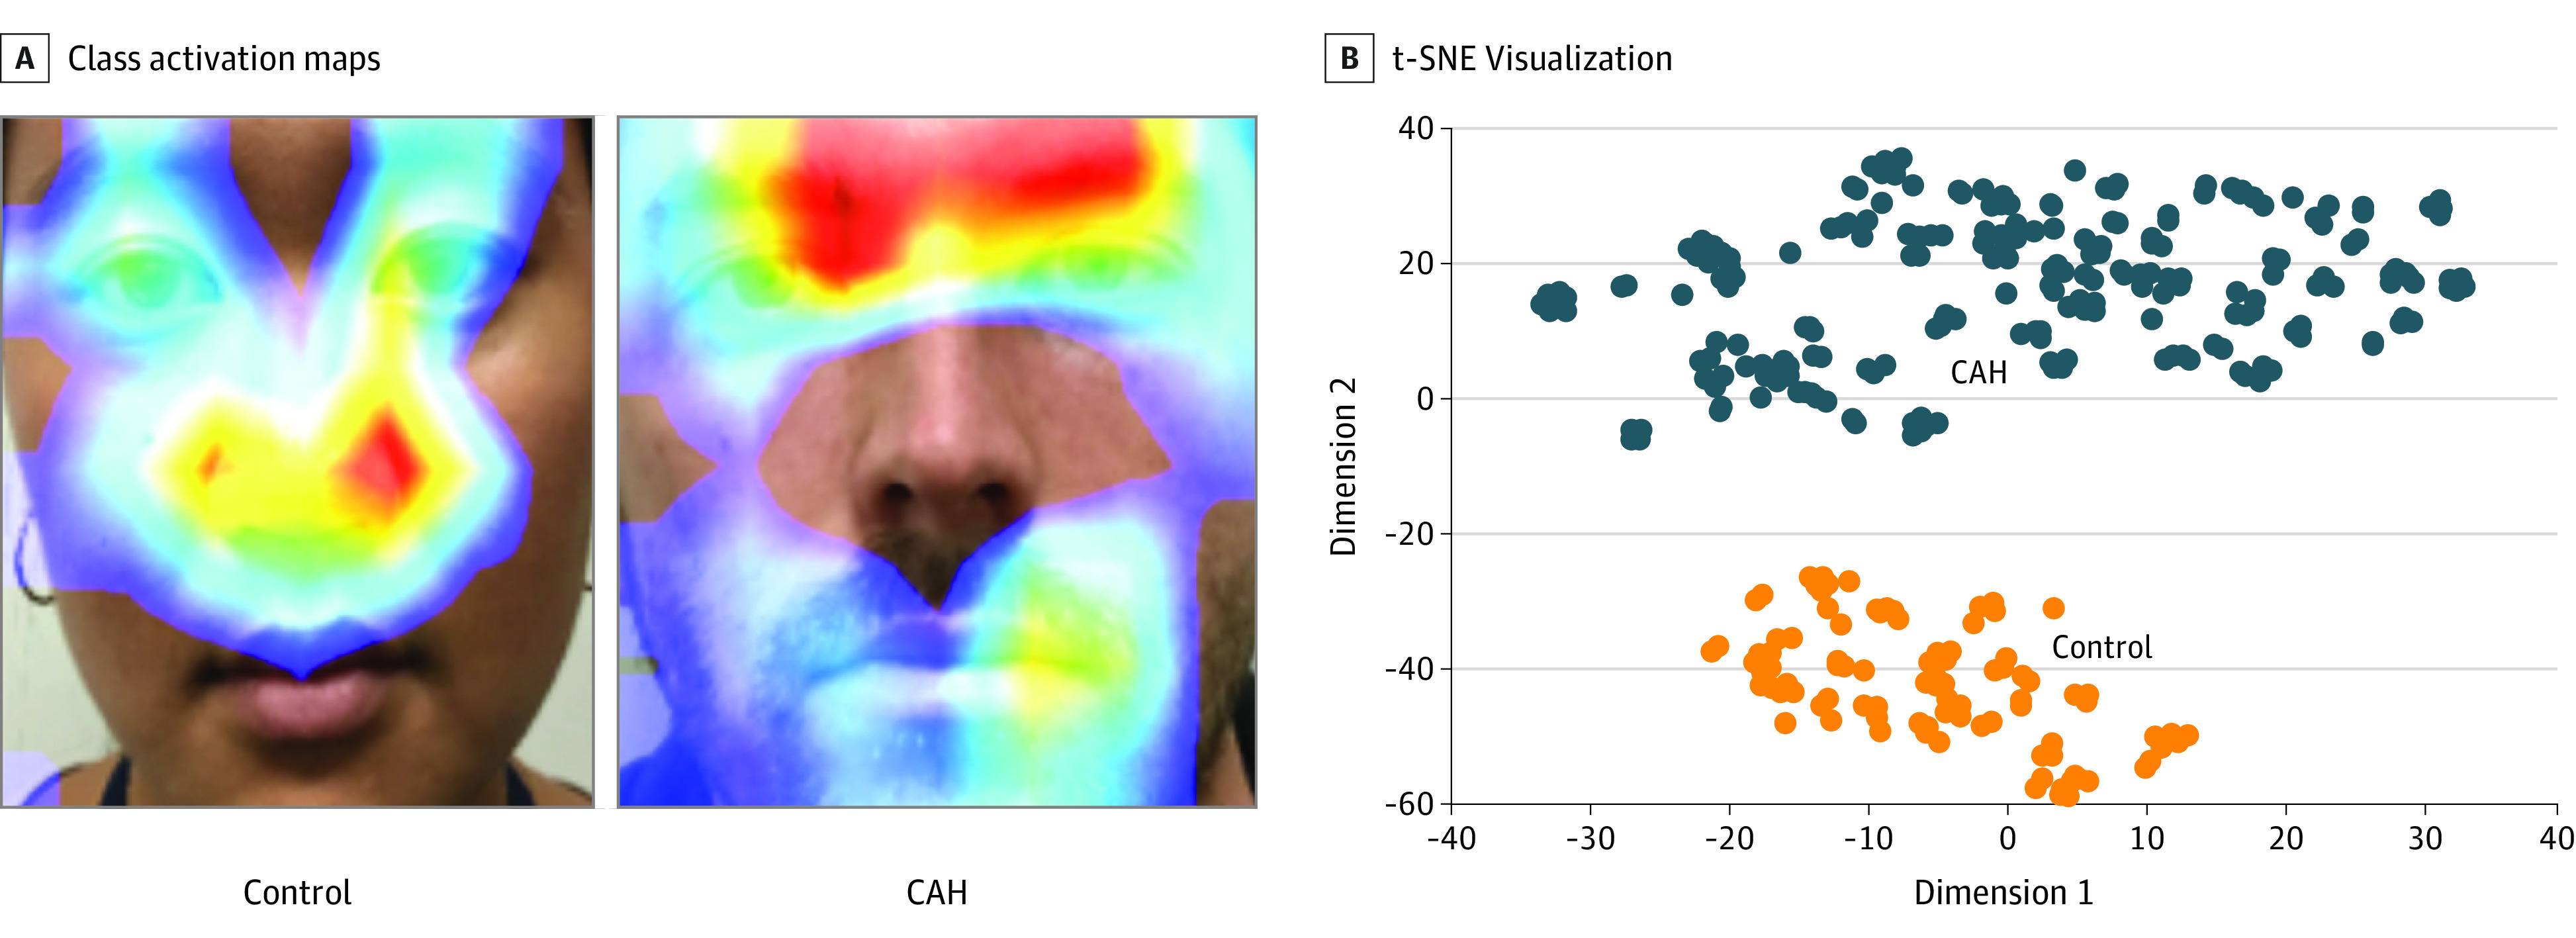
Figure 4. Class Activation Maps and t-Distributed Stochastic Neighbor Embedding (t-SNE) Visualization.

A, Red areas indicate the more contributory regions to the final predicted congenital adrenal hyperplasia (CAH) score. B, Visualization of the class activation maps for patients with CAH and controls.
