
Figure 3.
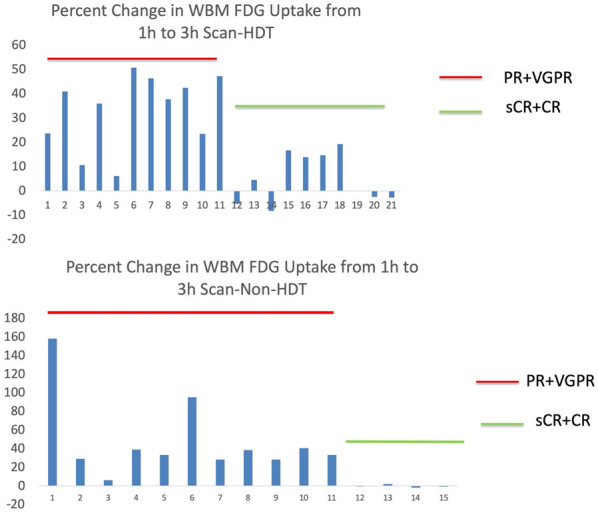
Bar charts showing percent change in WBM 18F-FDG uptake from 1 h to 3 h scans in the HDT group (top) and non-HDT group (bottom).
Official websites use .gov
A
.gov website belongs to an official
government organization in the United States.
Secure .gov websites use HTTPS
A lock (
) or https:// means you've safely
connected to the .gov website. Share sensitive
information only on official, secure websites.
Bar charts showing percent change in WBM 18F-FDG uptake from 1 h to 3 h scans in the HDT group (top) and non-HDT group (bottom).