
Figure 4.
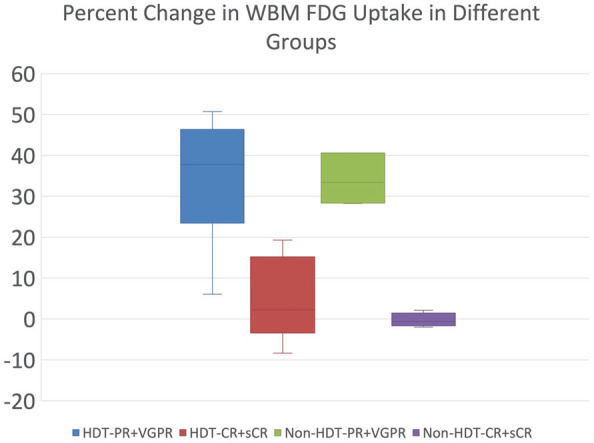
Box plots showing percent change in whole bone marrow FDG uptake from early to delayed scans. Patients were stratified by treatment group (HDT or non-HDT) and response to treatment (PR and VGPR or CR and sCR). The outliers are not shown here.