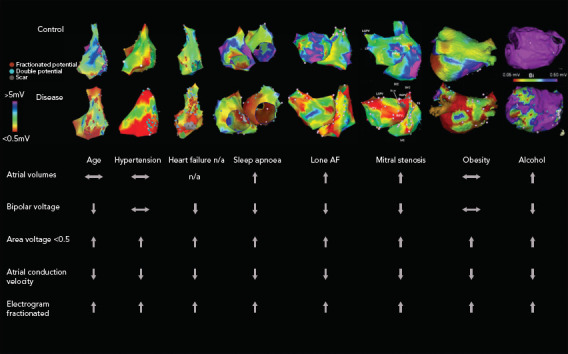
Figure 1: Electroanatomical Maps and Electrophysiological Parameters in Different AF Substrates.

Electroanatomical maps from various AF substrates are shown with bipolar voltage scaled from red for <0.05 mV to purple for > 5mV (except alcohol maps, which are scaled from <0.05 to >0.5 mV). Points with fractionated or double potentials or scar are annotated with red, blue and grey dots, respectively. n/a=not available. Sources: Kistler et al. 2004,[38] Dimitri et al. 2012,[33] Stiles et al. 2009,[41] Mahajan et al. 2018[30] and Voskoboinik et al. 2019.[36] Adapted with permission from Elsevier. Medi et al. 2011.[25] Adapted with permission from Wiley. Sanders et al. 2003.[22] Adapted with permission from Wolters Kluwer. John et al. 2008.[14] Adapted with permission from Oxford University Press.
