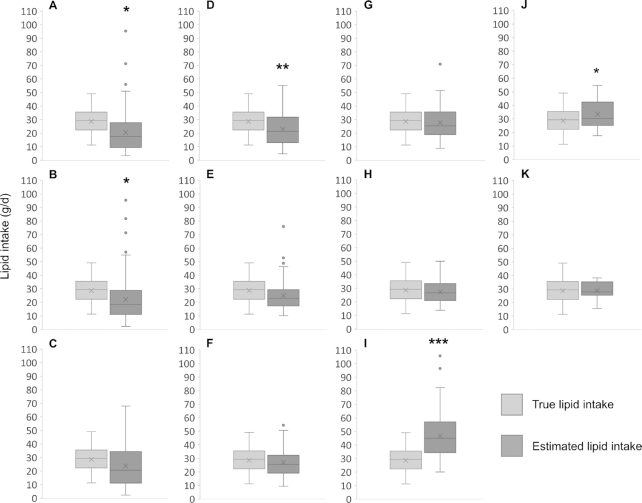
FIGURE 2.
Daily lipid intake (g/d) comparison for each sampling protocol, estimated using 800 mL/d intake volume compared to the true infant lipid intake, measured by 24-hour sampling and test weighing. (A) 1/pre/am; (B) 1/pre/am/L; (C) 1/pre/am/R; (D) 2/pre/am/LR; (E) 3/pre/daily; (F) 3/pre/daily/L; (G) 3/pre/daily/R; (H) 6/pre/daily/LR; (I) 1/pre/drained; (J) 2/prepost/second; and (K) 6/prepost/daily. The numbers indicate how many samples were taken, with data shown as the mean for 2, 3, or 6 samples. Data are shown as median, lower and upper quartile, minimum and maximum, mean (x), and outliers (●). Asterisks indicate difference from true lipid intake: *P < 0.05; **P < 0.01; ***P < 0.001. Abbreviations: am, first feed of the day; daily, mean of samples taken from morning, afternoon, and evening; drained, sample from the most drained breast (highest lipid concentration) at any time through the day; L, left breast; pre, pre-feed sample; post, post-feed sample; R, right breast; second, second feed of the day.

