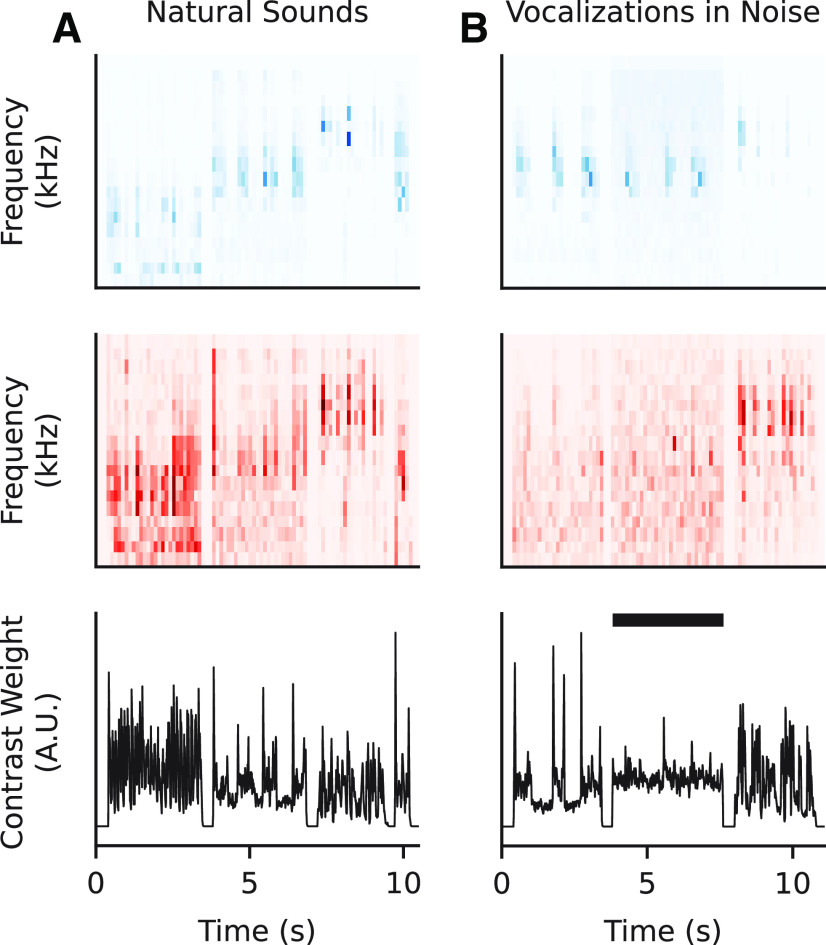
Figure 10.
Comparison of natural sound and clean/noisy vocalization properties. A, Top to bottom, stimulus spectrogram (blue), contrast (red), and frequency-summed contrast (black) for a sequence of three natural sound samples. B, Same as in A, but for vocalizations. The vocalization set contained interleaved trials of ferret vocalizations with and without additive noise. Black bar indicates segment with noise added.

