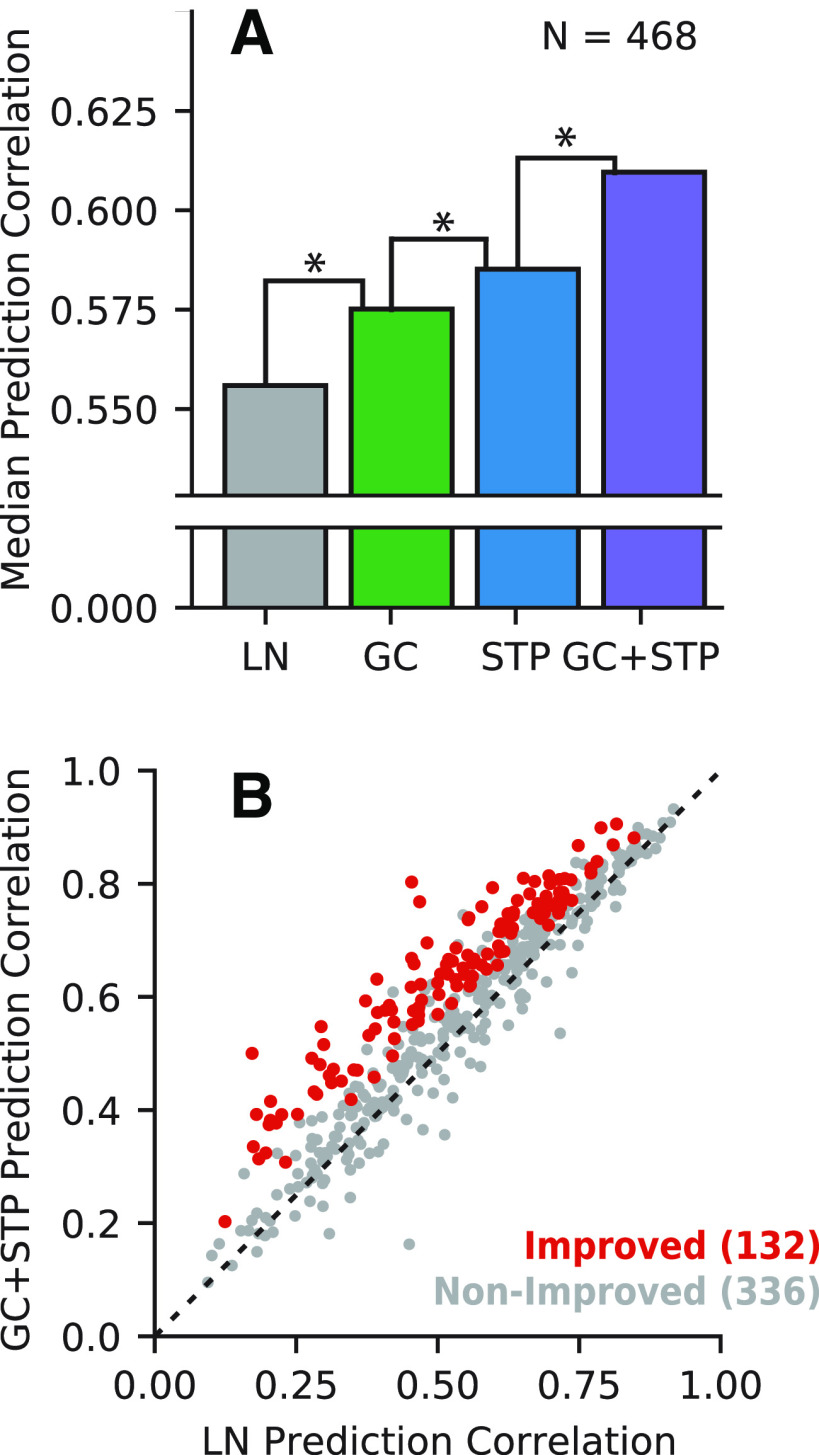
Figure 2.
Comparison of model prediction accuracy. A, Median prediction correlation for each model (n = 468 neurons). Differences between LN and GC (*p = 7.54 × 10⁻³⁰), GC and STP (*p = 5.00 × 10⁻⁴), and STP and GC+STP (*p = 2.02 × 10⁻²⁷) models were all significant (two-sided Wilcoxon signed-rank test). B, Scatter plot compares prediction correlation by the LN model and combined GC+STP model for each neuron. Color indicates whether the combined model showed a significant improvement (red, p < 0.05, permutation test) or not (gray).

