
Figure 8.
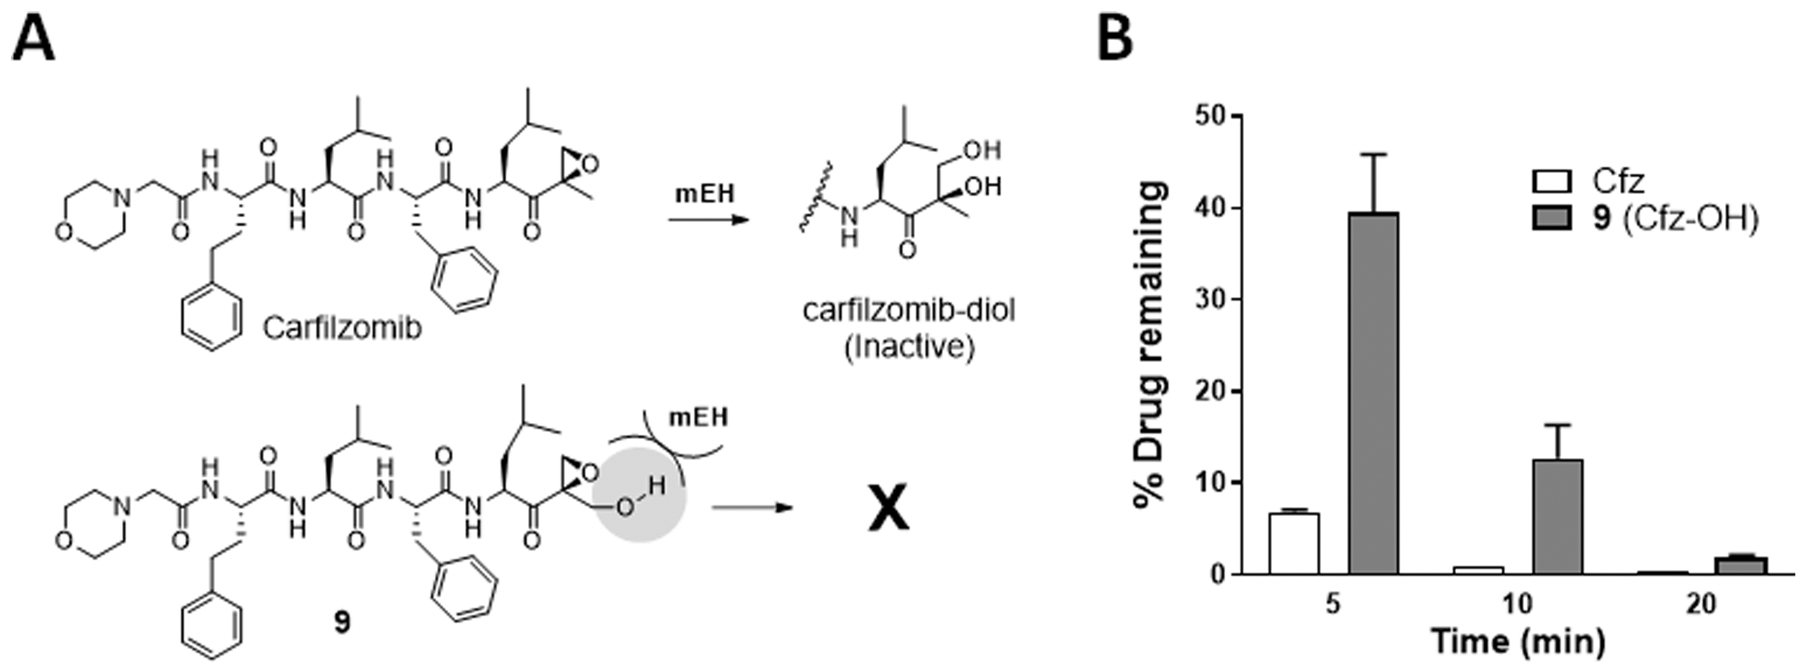
(A) Schematic depicting the rapid metabolism of Cfz by microsomal epoxide hydrolase (mEH) to the inactive diol. (B) Quantification of the remaining levels of Cfz or 9 following the incubation with rat liver homogenate containing active mEH and peptidase activities for 5, 10, and 20 min, respectively. Data presented as mean ± SD.