
Figure 2.
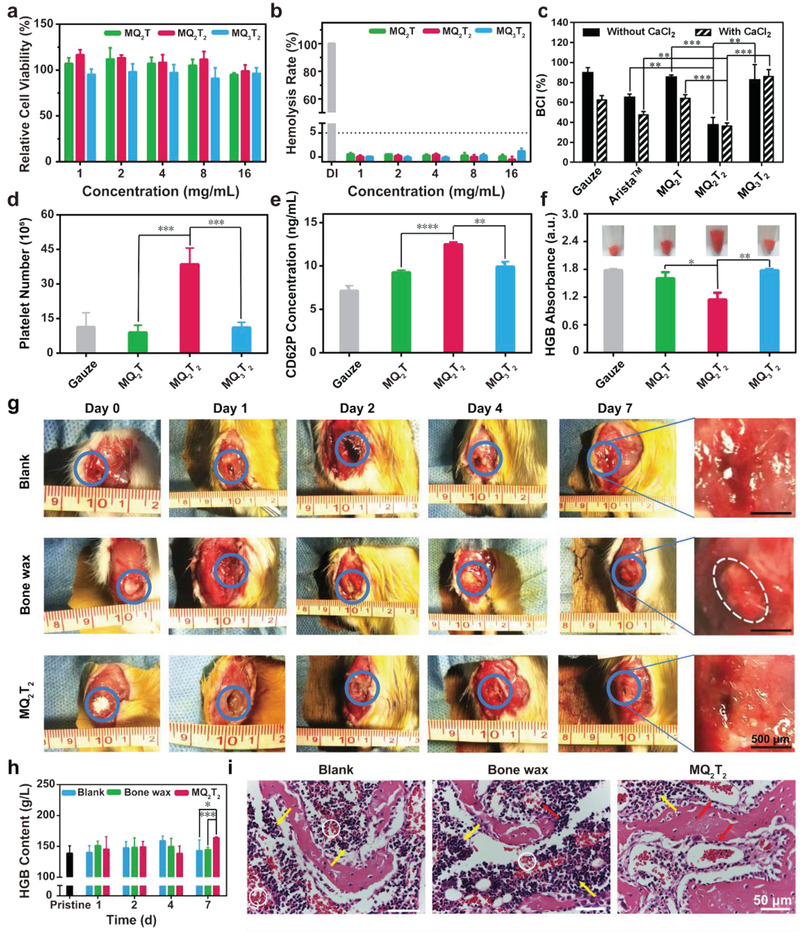
a) Cell viabilities and b) hemolysis rates of the MQ2T, MQ2T2, and MQ3T2 microparticles at various concentrations (n = 3–4). c) BCI index (n = 3), d) adherent platelet number (n = 4) and e) CD62P content of whole blood (n = 3) treated with the gauze, MQ2T, MQ2T2 and MQ3T2 groups. f) HGB content of adherent RBCs in the gauze, MQ2T, MQ2T2, and MQ3T2 groups after incubation with diluted whole blood (photographs are inserted) (n = 3). g) Representative photographs of bone apertures (blue circle indicates bone defect area and white circle indicates residual bone wax) and h) HGB contents (n = 3–7) of whole blood samples in the Blank, Bone wax and MQ2T2 groups during Day 0–7. i) H&E staining analysis of the defected bone samples in the Blank, Bone wax and MQ2T2 groups at Day 4 (white circle indicates bleeding sites, yellow arrow indicates inflammation‐associated cells and red arrow indicates repaired blood vessels). Data are presented as the mean ± SD. *p < 0.05, **p < 0.01, ***p < 0.001, ****p < 0.0001 among the marked groups using multiple t tests.