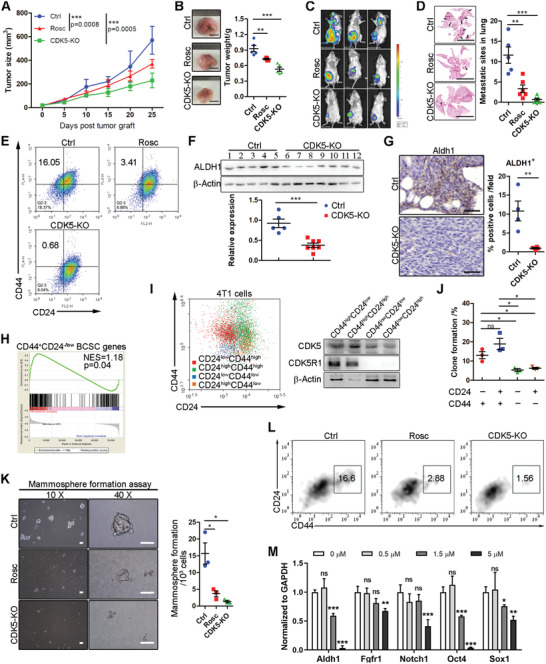
Figure 2.

CDK5 blockade inhibits metastasis and stemness in the TNBC mouse model. A) The growth of orthotopic 4T1 tumors in mice with different treatments as indicated (n = 6 for each group). B) Left, representative images of tumor tissues isolated from mice described in A). Right, mean tumor weights are shown. C) Representative bioluminescence images of 4T1‐bearing mice with indicated treatments. D) Left, representative pictures of hematoxylin and eosin‐stained (H&E) sections of lung tissues. Right, quantification of pulmonary metastatic nodules. E) Representative flow cytometric analysis of CD44+CD24−/low BCSC population in 4T1 tumors. F) Immunoblot analysis of CSCs marker, ALDH1, expression in tumor tissues with or without Rosc treatment. β‐Actin was analyzed as a loading control. The ALDH1 expression level was quantified using ImageJ. G) Representative IHC images for ALDH1 expression in 4T1 tumor tissues with indicated treatments. The ratios of ALDH1‐positive cells in each field were quantified. H) Gene set enrichment analysis of alterations in BCSC signature genes after CDK5 inhibition. I) Immunoblot analysis of CDK5 and CDK5R1 expression in each subtype of 4T1 cells as indicated. J) Colony formation analysis of each subtype of 4T1 cells. K) Mammosphere formation in 4T1 cells treated as indicated. Left, a representative image of mammospheres. Right, quantification of mammospheres, counted using a microscope with size ≥ 50 µm. Scale bars = 50 µm. L) Representative flow cytometric analysis of CD44highCD24−/low BCSC population in mammospheres. M) mRNA level of BCSC‐related signature genes (Aldh1, Fgfr1, Notch1, Oct4, and Sox1). Data represent mean ± SEM. The experiments were repeated at least twice to observe concordant statistical significance. *p < 0.05, **p < 0.01, ***p < 0.001.
