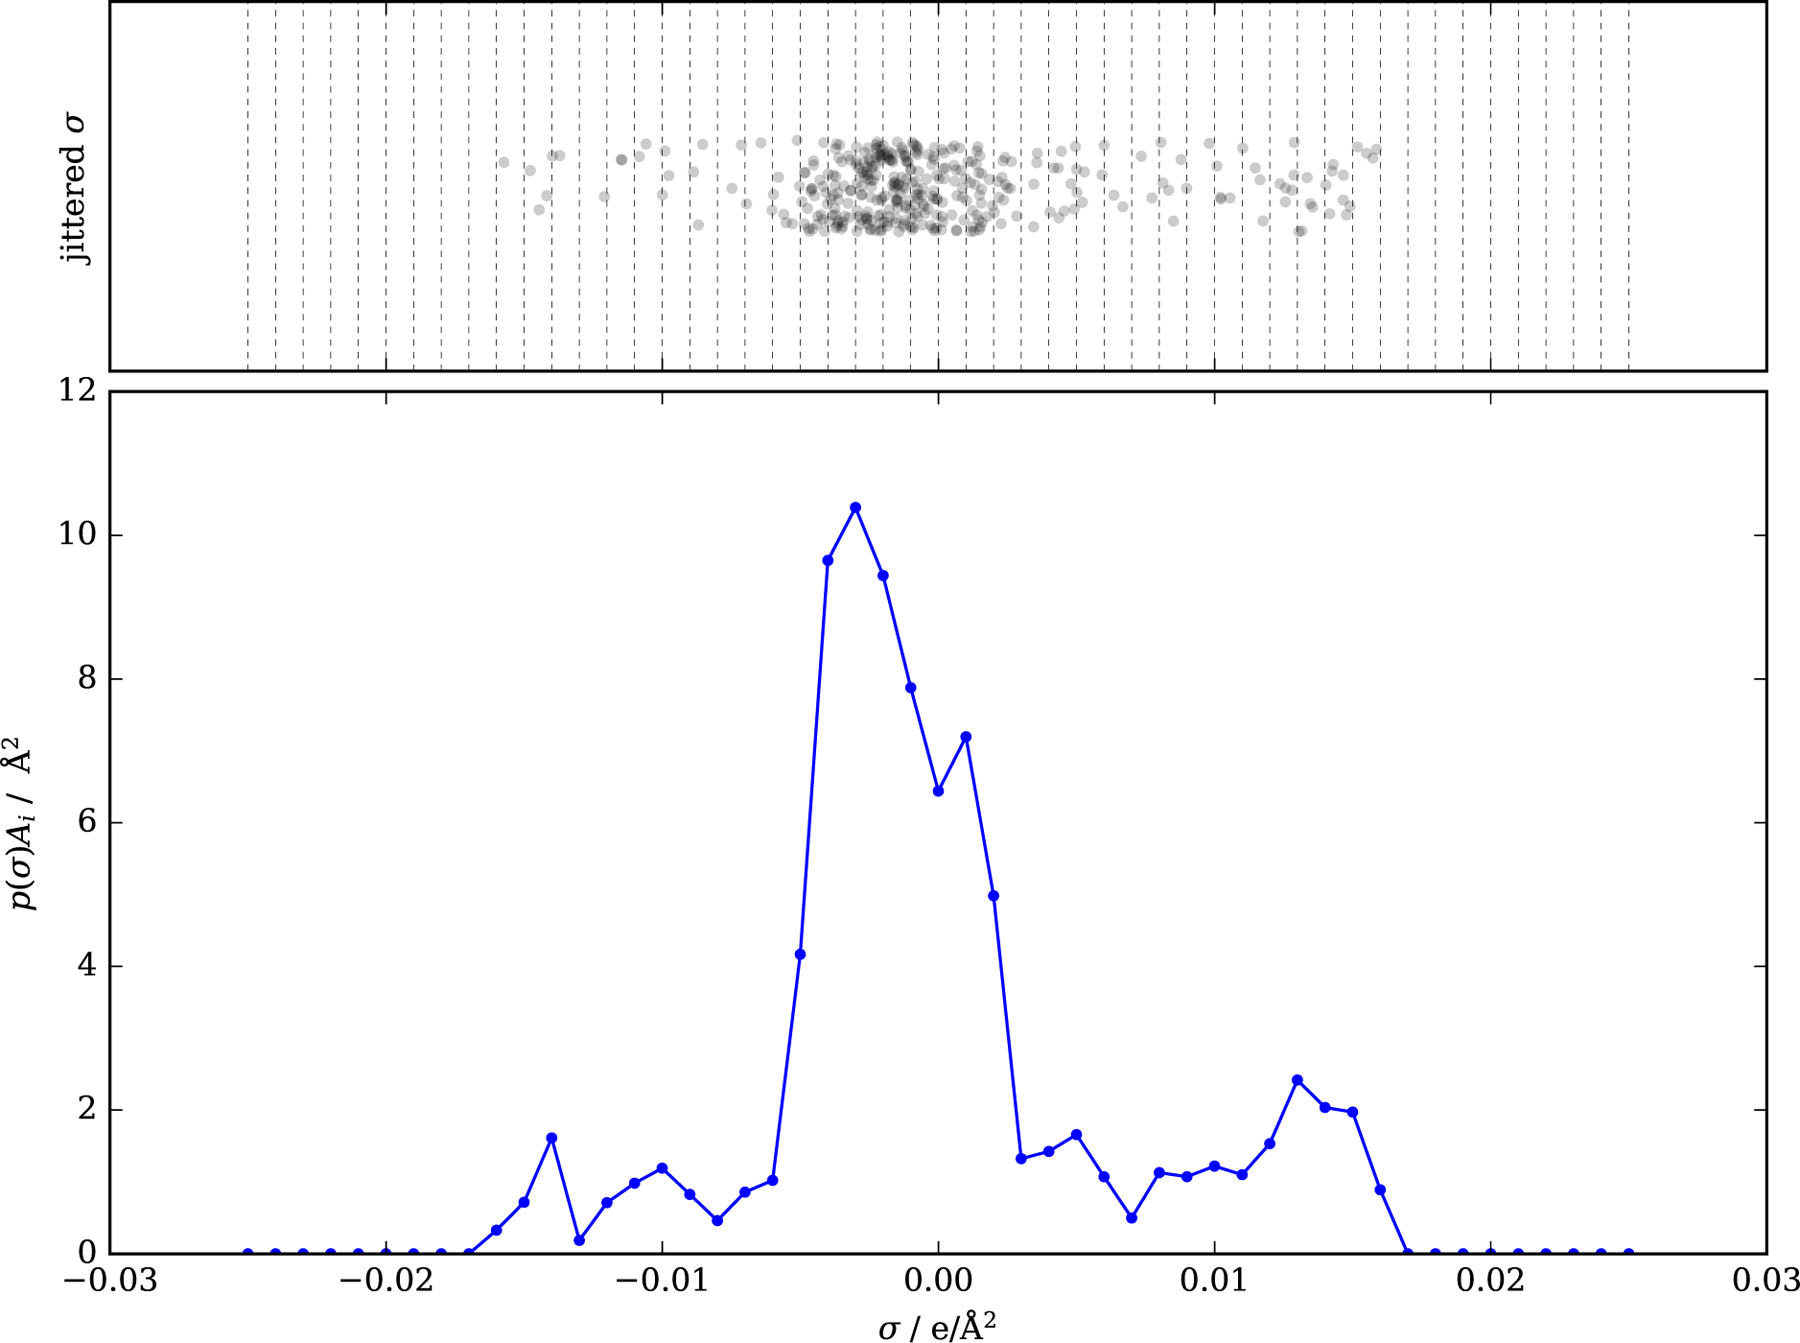
Figure 3:

Sigma values for ethanol (single profile, with averaging scheme of Mullins) Top: Values of averaged charge densities on segments (randomly jittered in the vertical direction). Vertical lines correspond to the nodes at which the sigma profile will be generated. Bottom: Sigma profile generated from these σ values.
