
. 2020 Dec 18;29(2):438–445. doi: 10.1002/oby.23066
© 2020 The Obesity Society
This article is being made freely available through PubMed Central as part of the COVID-19 public health emergency response. It can be used for unrestricted research re-use and analysis in any form or by any means with acknowledgement of the original source, for the duration of the public health emergency.
Figure 1.
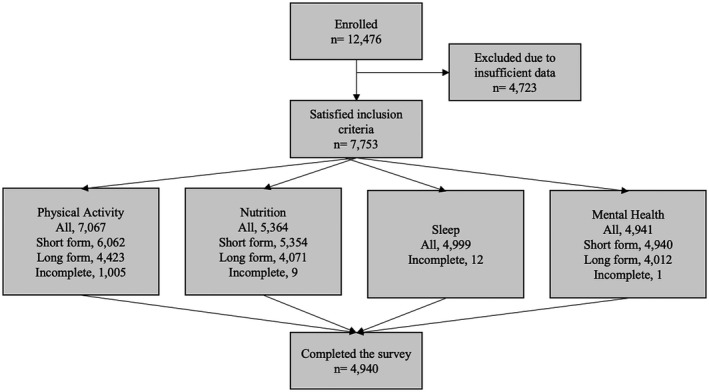
CONSORT diagram of the survey responses.