
Figure 2.
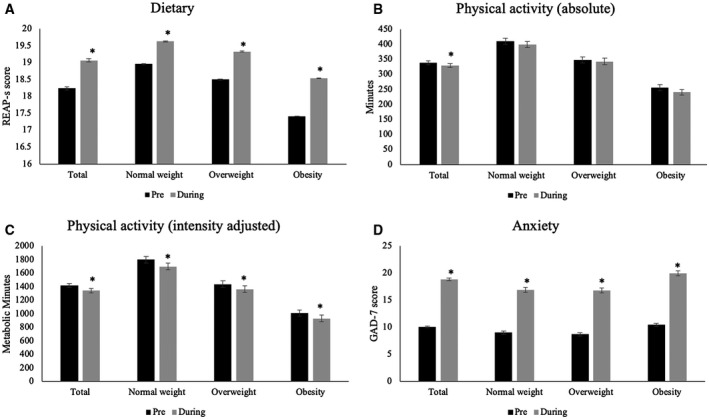
Overall changes to (A) dietary behaviors (REAP‐s), (B) time spent in physical activity (absolute minutes) and (C) time spent in physical activity (intensity adjusted), and (D) anxiety (GAD‐7 score) for the total sample and each BMI subgroup. Data are presented as mean ± SEM, and “*” denotes a significant difference between pre (black bar) and during (April 2020; gray bar) the COVID‐19 pandemic.