
FIGURE 5.
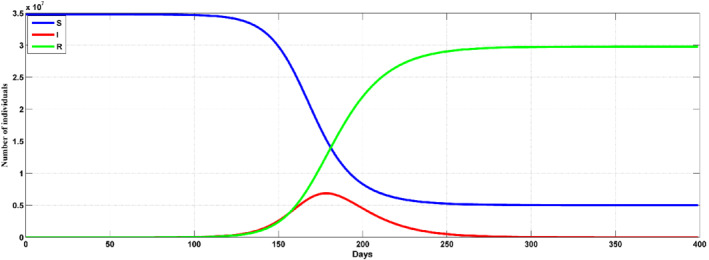
Prediction with SIR for the Saudi Arabia with R 0 = 2.4. The risky population S(t) = blue line, infections I(t) = red, recoveries R(t) = green line
Official websites use .gov
A
.gov website belongs to an official
government organization in the United States.
Secure .gov websites use HTTPS
A lock (
) or https:// means you've safely
connected to the .gov website. Share sensitive
information only on official, secure websites.
Prediction with SIR for the Saudi Arabia with R 0 = 2.4. The risky population S(t) = blue line, infections I(t) = red, recoveries R(t) = green line