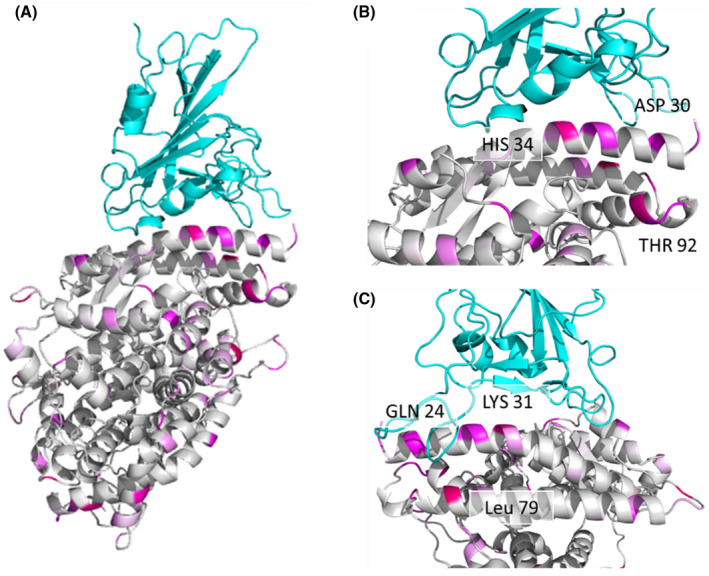
FIGURE 1.

Multiple residues with high GroupSim scores are present at the interaction interface of the SARS‐CoV‐2 RBD and ACE2 complex. (A) SARS‐CoV‐2 RBD (top) and human ACE2 (bottom) complex shown as a ribbon diagram with GroupSim scores color coded in magenta. Higher scores are brighter in color. (B) Close‐up view of the interface highlighting ACE2 residues with high GroupSim scores. (C) Close‐up view after 90‐degree rotation from (B) demonstrating additional residues at the interface with high GroupSim scores
