FIGURE 9.

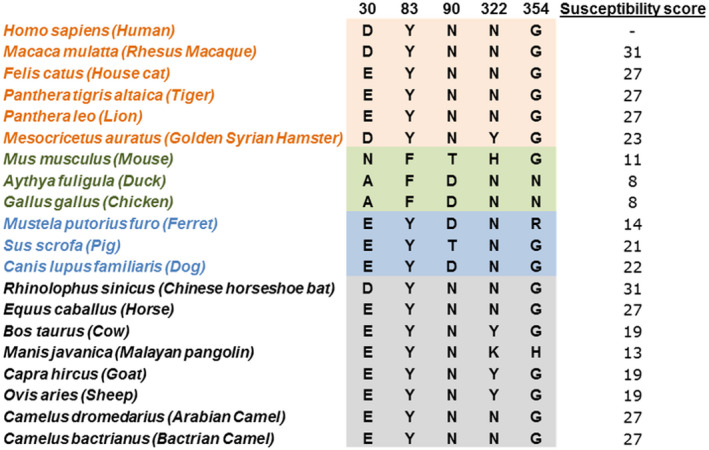
Key residues of aligned ACE2 proteins with calculated SARS‐CoV‐2 susceptibility score for each species. Susceptible (orange), non‐susceptible (green), intermediate (blue), and unknown (black/grey) species are indicated

Key residues of aligned ACE2 proteins with calculated SARS‐CoV‐2 susceptibility score for each species. Susceptible (orange), non‐susceptible (green), intermediate (blue), and unknown (black/grey) species are indicated