
Figure 1.
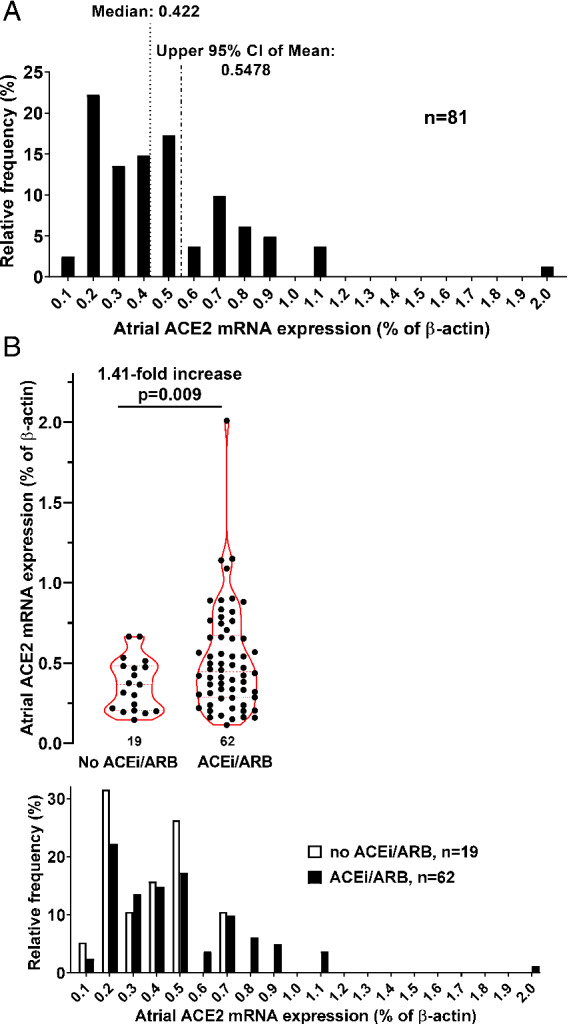
Atrial angiotensin‐converting enzyme 2 (ACE2) mRNA expression in patients treated with angiotensin‐converting enzyme inhibitor/angiotensin II receptor blocker (ACEi/ARB). (A) Frequency distribution of ACE2 expression. Vertical lines indicate median and upper 95% confidence interval (CI). (B) Scatter and violin plots of atrial ACE2 mRNA expression stratified by patients treated with either ACEi/ARB or not and the corresponding frequency distribution underneath.