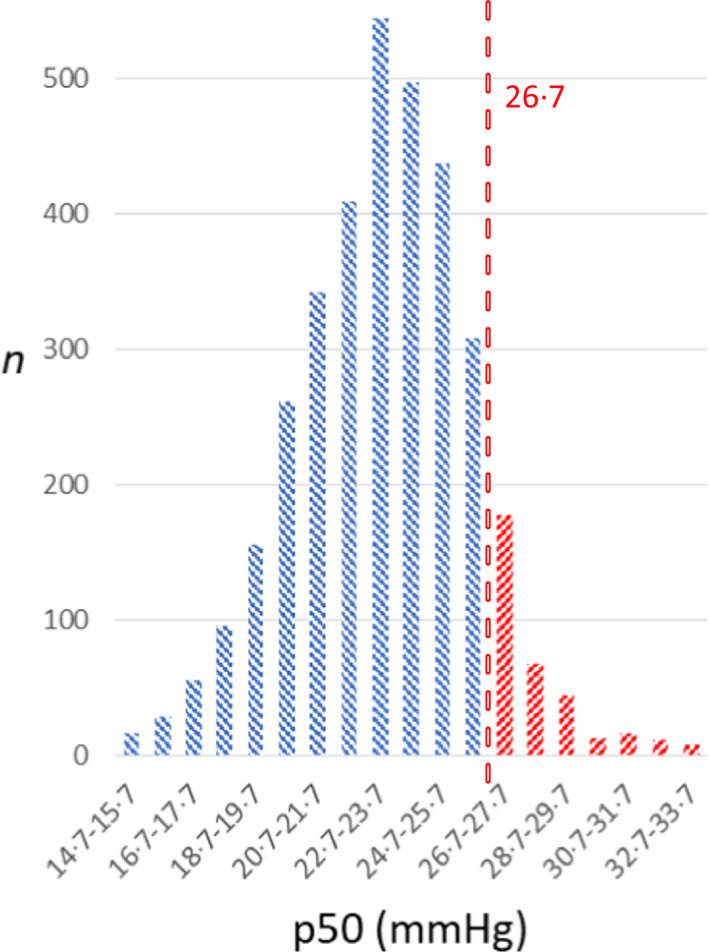
Fig 1.

Distribution of p50 values calculated using Hill equation (Eq. 1) from measured pO2 and SO2 (n = 3518). Blue indicates left shift and red indicates right shift of oxyhaemoglobin affinity from the standard p50 value. Dashed line at 26·7 mmHg indicates standard value for p50. [Colour figure can be viewed at wileyonlinelibrary.com]
