
FIGURE 2.
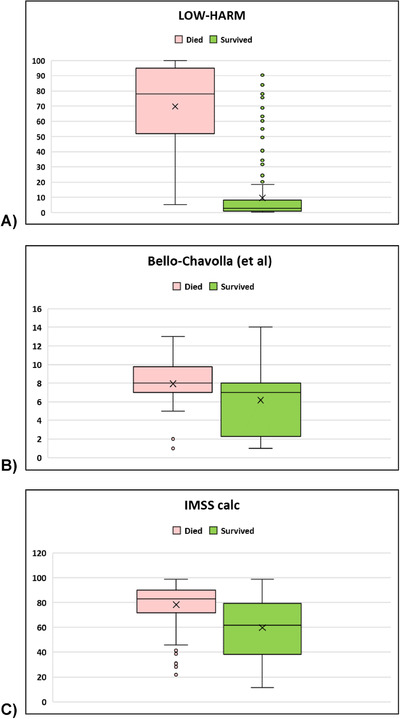
Distribution of scores according to clinical outcome in our sample using different scores. n = 200 per group. For all scores, P < 0.01 when compared with Student's t test for independent samples. However, the difference between means was larger for the LOW‐HARM score because of better identification of survivors (60 vs 2 vs 18). IMSS, Instituto Mexicano del Seguro Social