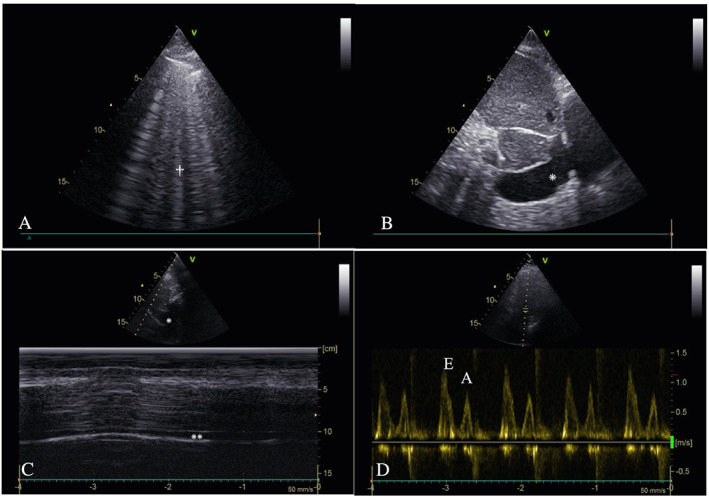
FIGURE 1.

Example of chest ultrasound views in COVID‐19. (A) Right anterior superior lung ultrasound B lines† in an 86‐year‐old male patient at 8 days from the onset of COVID‐19. (B) Enlarged inferior vena cava* measuring >2 cm in a 75‐year‐old female patient at 3 days from the onset of COVID‐19. (C) Normal motion mode profile of an inferior vena cava* with collapsibility >50%**, in an 89‐year‐old female patient 1 day from the onset of COVID‐19. (D) Increased E/A ratio > 1, 4‐apical chamber view, with EE wave higher than AA wave in a 98‐year‐old male patient at the onset of COVID‐19.
