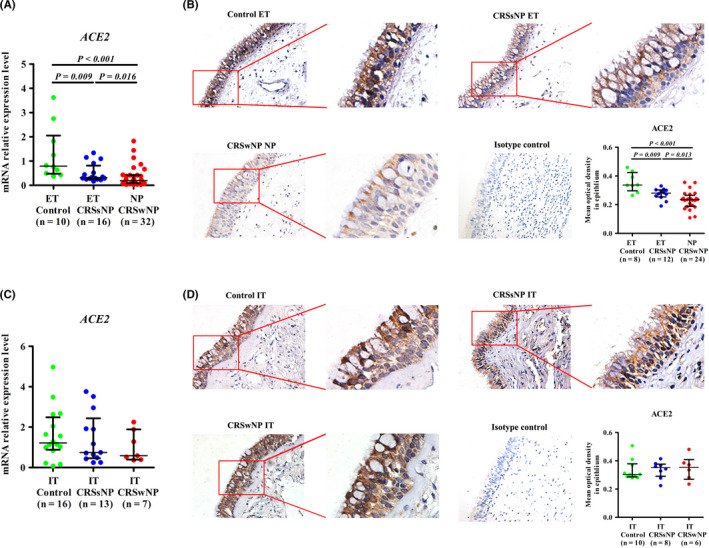
FIGURE 1.

ACE2 expression in the sinus mucosa and IT samples from patients with CRS. A, The mRNA expression levels of ACE2 in normal ET from control subjects, diseased ET from CRSsNP patients, and NP from CRSwNP patients as detected by quantitative RT‐PCR. B, The immunoreactivity of ACE2 in sinus mucosal samples as detected by immunohistochemistry. C, The mRNA expression levels of ACE2 in IT samples from control subjects, CRSsNP patients and CRSwNP patients as detected by quantitative RT‐PCR. D, The immunoreactivity of ACE2 in IT samples as detected by immunohistochemistry. For B and D, the representative photomicrographs are shown (original magnification × 400). A higher magnification of the outlined area is shown as an inset. The staining intensity in the epithelium was quantified and the results are presented as the average optical density value per unit area. Data are presented as the median and interquartile range. The Kruskal‐Wallis H test was used to assess significant intergroup variability. The Mann‐Whitney U 2‐tailed test was used for between‐group comparisons. Significance was set at a P value of less than 0.017. ACE2, angiotensin‐converting enzyme II; CRSsNP, chronic rhinosinusitis without nasal polyps; CRSwNP, chronic rhinosinusitis with nasal polyps; IT, inferior turbinate tissues; ET, ethmoid sinus tissues; NP, nasal polyps
