
Figure 2.
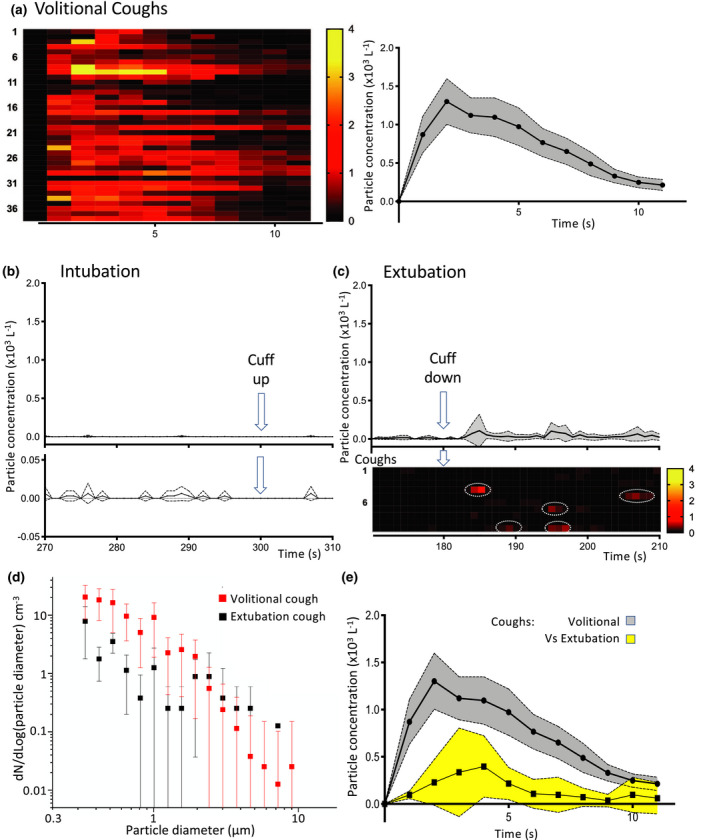
Aerosol measurements during intubation and extubation in operating theatre environment. (a) Temporal profile of aerosol generation from volitional coughs. Individual recordings (n = 38) represented on heat map showing the total number particle concentration over time. Average time course plotted (mean with 95%CI) showing a peak after 2 s and a rapid decay back to baseline. (b) Profile of the total number concentration of aerosol detected during the critical phase of intubation (arrow at 300 s marks completion of intubation with cuff up). When plotted on the same scale as the cough (b) then this looks essentially flat and when shown on a ten‐fold expanded scale below it can be seen that it is not significantly different to baseline as the confidence intervals always span zero (mean ± 95%CI). (c) Extubation recordings from each patient (n = 10) plotted as the average and individually as rows on heat map of number concentration of particles (lower, on same scale as b). This showed sporadic aerosol events (red, ringed) after cuff deflation set on a low baseline level of particles. The average concentration of aerosol shown above was low overall (mean ± 95%CI). (d) The extubation cough events (n = 5) had a similar aerosol particle size distribution to volitional coughs with a predominance of diameters < 1 µm (mean ± SD). (e) The extubation coughs were of a smaller magnitude than the volitional coughs (particle number concentration profile shown overlaid, mean ± 95%CI).